Document Type : Original article
Subjects
Abstract
Background: Non-Alcoholic Fatty Liver Disease (NAFLD), strongly linked to obesity and metabolic syndrome, is a leading cause of liver cirrhosis. Early and accurate diagnosis is essential to prevent progression. NAFLD is commonly diagnosed using ultrasound, and obesity is known to limit the quality of ultrasound assessment. This disadvantage may be eliminated with Magnetic Resonance (MR) modality. MR fat quantification is potentially effective in directly determining hepatic steatosis. This study aimed to evaluate if MR is a suitable option to ultrasound with correlation to Body Mass Index (BMI) and Alanine Transaminase (ALT) in patients with obesity.
Methods: A prospective cohort pilot study was conducted in Malaysia between January 2020 and July 2021, involving 34 adult obese patients (BMI range: 30–45 kg/m2). All the patients were subjected to ultrasonography, MR, anthropometrics, and serum ALT measurements. MR Fat fraction (MR-PDFF) and spectroscopy using Stimulated-Echo-Acquisition-Mode (MRS-STEAM) and Point-Resolved-Spectroscopy (MRS-PRESS) were used for fat quantification. The results were analysed using Pearson and Spearman correlation tests.
Results: The mean values for BMI and ALT are 37.91 and 20.50 respectively. MR showed a significant positive correlation with ultrasound in quantifying liver fat (MRS-STEAM r=0.713, MRS-PRESS r=0.882 and MR-PDFF r=0.961, p<0.05). MRS-PRESS, MR-PDFF and ultrasound indicated a positive correlation with BMI (MRS-PRESS r=0.408, MR-PDFF r=0.385 and ultrasound r=0.477, p<0.05). MRS-STEAM showed no correlation with BMI. All the three MR acquisitions and ultrasound demonstrated positive correlation with ALT level (MRS-STEAM r=0.389, MRS-PRESS r=0.483, MR-PDFF r=0.478 and ultrasound r= 0.487, p<0.05).
Conclusion: Magnetic resonance can be potentially used as a safe alternative tool in managing NAFLD in obese patients. A study with larger sample size with adjustments to confounding parameters is required to evaluate the MR as an effective diagnostic tool for NAFLD in obese patients.
Keywords: Alanine Transaminase, Body mass index, Liver cirrhosis,
Magnetic resonance spectroscopy, Malaysia, Metabolic syndrome, Non-alcoholic fatty liver disease
Introduction
Non-Alcoholic Fatty Liver Disease (NAFLD) is a hepatic manifestation of metabolic syndrome that affects both adult and paediatric populations with prevalence of roughly 10-30% worldwide (1,2). NAFLD can be categorized into a spectrum of disorders according to the pathological changes, ranging from simple steatosis and steatohepatitis, which may eventually cause chronic liver disease (cirrhosis) (3-5). NAFLD can disrupt liver enzymes production and has a strong correlation with metabolic syndromes in obese patients (6,7). Previous studies reported that excessive Body Mass Index (BMI) was associated with the increased risk of fatty liver, and the risk of NAFLD and Non-Alcoholic Steatohepatitis (NASH) increased approximately 4.1 to 14-fold in obese or overweight patients (8).
Accurate method of liver fat quantification is needed due to the health implications of NAFLD together with possible reversibility with lifestyle interferences and medications. To date, the current gold standard in diagnosing NAFLD is liver biopsy, but it has a few constraints such as invasiveness, cost, patient’s discomfort, sampling error and inter-observer variability. Moreover, liver biopsy can cause complications such as bleeding and perforation, hence this method is not appropriate for screening and long-term treatment monitoring (9,10). Therefore, it is necessary to have a safe non-invasive, and reliable method to evaluate and measure liver fat content without sampling variability. On the other hand, the use of ultrasound and Computed Tomography (CT) as imaging methods to evaluate patients with NAFLD also have limited accuracy (11), especially in obese population. Ultrasound can only measure moderate and severe hepatic steatosis qualitatively, but not sensitive in detecting mild fat accumulation in severely obese patients (2,6). In the meantime, the use of computed tomography lacks sensitivity and specificity in differentiating simple steatosis from NASH and due to its potential radiation hazard, it is not suitable for long term monitoring (6,10).
Magnetic Resonance Imaging (MRI) with Magnetic Resonance Spectroscopy (MRS) are more reliable and effective when compared to US and CT in verifying liver fat content with high diagnostic accuracy (12). Both MRI with MRS can measure fat fraction by quantifying lipid and water proton signals directly in liver tissue, hence suit clinical and research needs (13). In Malaysia and many other countries, the commonly used method of diagnosing NAFLD is only dependent on clinical suspicion, biochemical parameters, and sonography. Nonetheless, these tools do not reliably reflect the spectrum of liver histopathology, which is usually evaluated via liver biopsy (14). Liver biopsy is the gold standard in diagnosing NAFLD but liver biopsy is an invasive procedure. It can carry risks and complications including pain (30 to 50%), severe bleeding (0.6%), perforation and injury to adjacent organs (0.08%), small but not negligible risk of hospitalization (1-3%) and even death in rare cases (up to 0.1%) (15).
Although there are only several reports about MRI and MRS, the use of these techniques to the liver has shown promising results. MR technique is easy to operate, non-invasive and can provide highly accurate quantitative measurement of hepatic steatosis when compared to ultrasound. Furthermore, when evaluating liver fat accumulation using MRI and MRS, there is no radiation exposure to patients with NAFLD. Unfortunately, there is lack of data regarding the effectiveness of MRI and MRS in assessing hepatic steatosis in obese patients with NAFLD. Hence, this study was conducted to investigate the impact of NAFLD in obesity using MRI as an effective diagnostic apparatus as compared to ultrasound. In addition, MRI might be a better option of non-invasive imaging methods to detect hepatic steatosis in obese patients, thus filling the gap in the knowledge and give potentially vital information for future clinical and research studies of NAFLD in obese population.
Materials and Methods
Sample collection
The study was conducted in Radiology Department, Hospital Pengajar University Putra Malaysia (HPUPM), Selangor, Malaysia between 1st January 2019 and 30th November 2021. The ethical approval for research involving human subject was obtained from the Ethics Committee of Faculty of Medicines and Health (reference number JKEUPM- 2019-330) and informed consent was collected from all the participants. The quality controls of MRI, MRS and Ultrasound (USG) scanning were evaluated by a qualified radiologist.
This study was a prospective cohort that involved thirty-four surgical outpatients aged 18 years old and above, were obese with BMI between 30-45 kg/m2 and were suspected to have NAFLD. Patients who were pregnant, or had viral hepatitis, drug-induced hepatitis, alcohol-related fatty liver (alcohol consumption greater than 20 g/day) or had contraindications for MRI scan such as recent ferromagnetic implant, cochlear implants, pacemakers, and claustrophobia were excluded from the study. Sample size was calculated using a single correlation formula (Lachin, 1981). A total of 34 patients were selected based on the sample size calculation (35) (10,16).
The patients were kept fasted for 6 hrs prior to the USG scan. Anthropometric data included body weight, height, BMI, and Waist Circumference (WC) of the patients were recorded on the day of scanning, and patients were subsequently subjected to MRI with MRS, and ultrasound imaging. BMI was measured as body weight in kilograms divided by height in metres (kg/m2). The radiology findings and biochemical results were recorded.
Ultrasound (USG) scanning
USG abdomen was performed by two medical officers of Radiology Department of similar background and radiology experience, using Canon Aplio i800 ultrasound machine with a curvilinear transducer (3-5 MHz) via right intercostal access. The patient was examined in the supine position with the right arm elevated above the head for optimal intercostal access in a resting respiratory position. The ultrasound fat infiltration was graded as Grade 0 as no fat infiltration (normal), Grade 1 when liver echogenicity diffusedly increased (mild); Grade 2 when echogenic wall of the portal vein branches is obscured by echogenic liver (moderate) and Grade 3 shows increased echogenicity results impaired beam penetration and limits visualization of liver and diaphragmatic outlines (severe).
MRI and MRS examinations
MRI and MRS examinations were performed using a 3.0T Philips Ingenia MRI scanner. Since MRI and MRS use strong magnetic field, special precautions were taken and patients with certain implanted devices (pacemakers or cochlear implants) or internal metal objects (surgical clips, plates, screws, or wire mesh) and patients who are claustrophobic are not eligible for an MRI. The distributions of the patient’s fat infiltration in MRI were based on following criteria (17), Grade 0: fat fraction less than 6.4%, Grade 1: fat fraction equal to or greater than 6.4% and less than 16.3%, Grade 2: fat fraction equal to or greater than 16.3% and less than 21.7% and Grade 3: fat fraction equal to or greater than 21.7%.
Before entering the scanner, the breath holding technique was explained to subjects and a short demonstration was done. The subjects were guided on breath holding and allowed to practice prior to entering scanner. The patients were examined in supine position and a body coil was used for the acquisition. T1, T2 and Dixon multiplanar images were acquired and used for voxel placement. Single-voxel MR spectroscopic data acquired in all the patients using both Stimulated-Echo-Acquisition-Mode (MRS-STEAM) and Point-Resolved-Spectroscopy (MRS-PRESS) sequences. The same 30×30×30 mm (27-mL) voxel was manually placed in segment VII of liver on the axial T1-weighted sequence, avoiding large vessels, bile ducts, edges of liver, extrahepatic fat, and organs adjacent to the liver. No contrast media was be given.
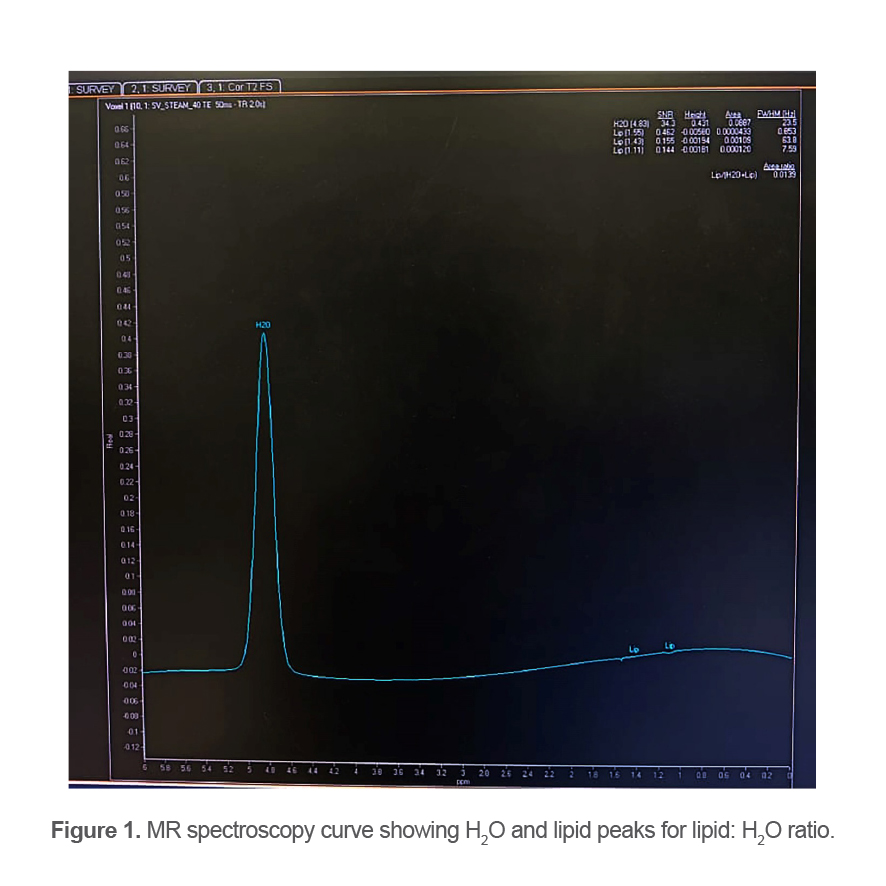
Evaluation of the total hepatic triglycerides was done by integrating all 6 peaks (at 0.9, 1.3, 2.1, 2.75, 4.2 and 5.3 ppm). From the MR spectra, liver fat content was calculated using the formula (e.g. for methylene): (100 x AHTGC)/ (AHTGC + AWATER), where AHTGC and AWATER are the areas of the total hepatic triglycerides and water peaks, corrected for both T1 and T2 effects.
Image analysis
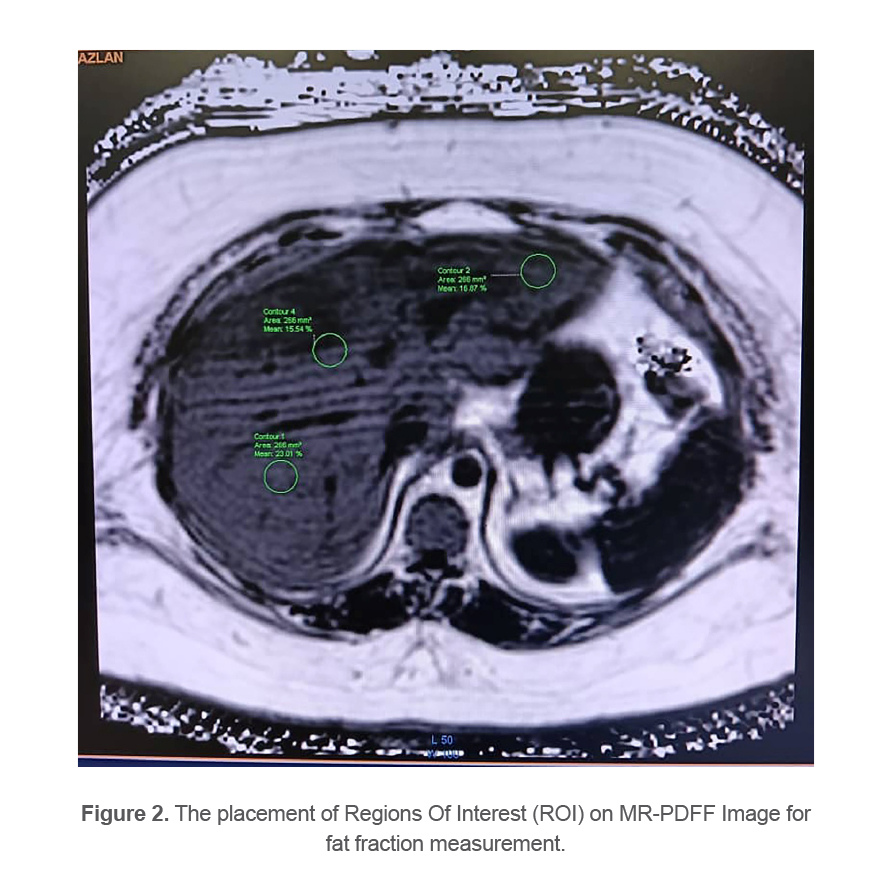
MRS data was analysed using LC Model software. The MR spectroscopy curve showing H2O and lipid peaks for lipid: H2O ratio is shown in figure 1. The fat fraction was obtained by manually drawing a small Region Of Interest (ROI) approximately 500 to 600 mm2 in Dixon images and positioned it in each segment of the liver and the final average ROI values were calculated. The placement of ROI on MR-PDFF Image for fat fraction measurement is shown in figure 2. Hepatic steatosis was defined as lipid accumulation of at least 6.4%.
Laboratory analysis
Serum was obtained from all the patients to determine the level of Alanine Transaminases (ALT).
Table 1. Demographic characteristics of patients
|
Characteristics |
|
|
Female, n(%) Male, n(%) |
27(79.4) 7(20.6) |
|
Age range(yrs) |
27-71 years |
|
Mean age(yrs) |
43.82(SD 10.58) |
|
BMI range(kg/m2) |
30-45 |
|
Mean BMI(kg/m2) |
37.91(SD 4.23) |
n-number, BMI-Body Mass Index, SD-standard deviation.
Table 2. Distribution of the patient’s fat infiltration based on USG grading compared with MR-PDFF
|
USG grading |
Number of patients (%) |
MRI-PDFF grading |
Number of patients (%) |
|
Normal(Grade 0) |
11(32.4) |
Grade 0(<6.4%) |
13(38.2) |
|
Mild(Grade 1) |
9(26.5) |
Grade 1(≥6.4%-16.2%) |
13(38.2) |
|
Moderate(Grade 2) |
8(23.5) |
Grade 2(≥16.3%-21.6%) |
4(11.8) |
|
Severe(Grade 3) |
6(17.6) |
Grade 3(≥21.7%) |
4(11.8) |
Abbreviations: USG-ultrasound, MRI-PDFF- magnetic resonance imaging fat fraction.
Table 3. Correlation between USG grading, Body mass index, Waist circumference, Alanine transaminase with USG grading, MRS STEAM, MRS PRESS, and MRI-PDFF
|
Variables |
USG grading |
MRS-STEAM |
MRS-PRESS |
MRI-PDFF |
||||
|
r-value |
p-value |
r-value |
p-value |
r-value |
p-value |
r-value |
p-value |
|
|
USG grading |
- |
0.713 |
0.000 |
0.882 |
0.000 |
0.961 |
0.000 |
|
|
Body mass index |
0.477 |
0.004* |
0.191 |
0.278 |
0.408 |
0.017 |
0.385 |
0.025 |
|
Waist circumference |
Correlation was not performed |
0.028 |
0.876 |
0.343 |
0.107 |
0.265 |
0.130 |
|
|
Alanine transaminase |
0.487 |
0.004 |
0.389 |
0.023 |
0.483 |
0.004 |
0.478 |
0.004 |
*Significant at p<0.05.
Abbreviations: r=Pearson correlation, USG-Ultrasound, MRS-STEAM-Stimulated-Echo-Acquisition-Mode, MRS-PRESS-Point-Resolved-Spectroscopy, MRI-PDFF-Magnetic Resonance Imaging Fat Fraction.
Statistical analysis
SPSS 23 (IBM Cor., Armonk, NY, USA) was administered for statistical analysis. Pearson correlation was used to determine the correlation between two sets of data that are parametric. In this study, BMI and WC of the patients were normally distributed based on the Kolmogorov Smirnov and Shapiro Wilk test (p-value >0.05). In the case where the data sets were not normally distributed (USG grading and ALT, p-value <0.05), Spearman non-parametric rank-order correlations were used. p-value of less than 0.05 was considered as statistically significant.
Results
Clinical characteristics of the patients
A total of 34 patients were included in this study. Table 1 shows the demographic characteristics of the patients.
Fat infiltration grading of USG
Table 2 indicates the distribution of the patient’s fat infiltration based on USG grading. No patient in the study was found to have cirrhosis.
Correlation of USG grading, MRS STEAM, MRS PRESS, and MR-PDFF with USG grading, BMI, WC, and ALT
Table 3 demonstrates the summary of the correlations between USG grading, BMI, WC, and ALT with USG grading, MRS STEAM, MRS PRESS, and MR-PDFF. The USG grading of the patients was strongly correlated with MRS STEAM (r=0.713, p<0.001), MRS PRESS (r=0.882, p<0.001), and MR-PDFF (r=0.961, p<0.001). BMI indicated weak correlation with USG grading (r=0.477, p<0.01), MRS PRESS (r=0.408, p<0.05), and MR-PDFF (r=0.385, p<0.05). However, BMI was found not correlated with MRS STEAM (r=0.191, p>0.05).
There was no correlation between WC and MRS STEAM (r=0.028, p>0.05), MRS PRESS (r=0.343, p>0.05), and MR-PDFF (r=0.265, p>0.05). Serum ALT of the patients were weakly correlated USG grading (r=0.487, p<0.01), MRS STEAM (r=0.389, p<0.05), MRS PRESS (r=0.483, p<0.01), and MR-PDFF (r=0.478, p<0.01).
Discussion
A total of 34 patients with a mean age of 43.8 years old participated in this study. There were three main dependent variables (MRS STEAM, MRS PRESS and MR-PDFF) and four independent variables (fat infiltration grading of USG, BMI, WC and ALT) were measured and discussed in terms of their relationship and correlations.
To determine the feasibility of MR in diagnosing hepatic steatosis in obese patients, USG was used as reference standard. This study significantly demonstrated a strong positive correlation in all three MRS STEAM, MRS PRESS and MR-PDFF with USG grading of fat infiltration in NAFLD (Table 3). Although there was no attempt to localise voxel placement in every lobe in MRS, it still showed a similar result with USG grading. Previously, MRI and MRS were proven to be excellent tools to evaluate hepatic steatosis (18). USG demonstrated reduced sensitivity between 60.9% to 65% in detecting mild fat accumulation (19,20). A comparison of MR PDFF with ultrasound also showed comparable results even in small sample. For example, there were 11.7% more Grade 1 fatty liver infiltration using MRI-PDFF compared to USG (Table 2). Nonetheless, a larger sample size is needed for the study to have more concrete conclusions. Currently, no study has given a standard reference point to grade liver fat infiltration using MRS, both in STEAM and PRESS, hence this limits their applicability to grade the severity. Additionally, USG is not specific for hepatic fat measurement as soundwaves of the USG can be affected by liver fibrosis, hepatitis, and hemochromatosis rather than the lipid accumulation. It is also quite challenging when measuring patients with high BMI and have severe fatty liver (Grade 3) due to lack of beam penetration. Therefore, MRS/MRI play an important role in detecting liver pathology includes NAFLD, fibrosis, cirrhosis as well as primary liver lesion and metastasis (20). Moreover, USG also requires an operator and can cause intra and inter observer variability. As one of dependent variables, USG grading had shown the strongest association with MRI fat fraction because MR-PDFF techniques allow quantification of lipid fraction of the whole liver, which was a limitation for both MRS and liver biopsy (1) and had high spatial resolution (21).
There was no correlation between BMI of patients and MRS STEAM measurement in this study (p-value >0.05). This result did not support previous studies which reported that liver fat content of obese/overweight group in MRS was statistically higher when compared to the control group (4). The reason might be due to the difference in J-coupling effect which is an intrinsic behaviour of all fat peaks (not the water peak) of MRS STEAM and MRS PRESS, affecting these acquisitions to provide altered estimates of the peak T2 values. Previous MR imaging literature had demonstrated that J-coupling effect accelerates signal decay and reduces the apparent T2 value of fat molecules hence both sequences may provide different results in liver fat quantification (9,22). Moreover, T1 bias and T2 relaxation effects might affect MRS, which can result in errors and small alteration in estimation of hepatic steatosis. T1 bias occurs from the difference in T1 relaxation times which results in relative amplification of the fat intensity, while T2 relaxation effect cause signal loss with increasing echo time. Therefore, correction for T1 and T2 relaxation effects are required for a consistent metabolite quantification (20).
There was a positive correlation between BMI and three dependent variables; MRS PRESS, MR-PDFF and USG grading, which demonstrated high risk of fatty liver disease in patients with higher BMI. The study consistently supports previous research by showing that patients with high BMI gain more adipose tissue and more fatty acid flows to the liver, which progressively increases the intrahepatic fat content (simple steatosis) (8,23-25). These observations usually happen in obese people due to amplification of the rich lipid and carbohydrates diet. It further increases de novo lipogenesis and worsens absorption of exogenous fat by hepatocytes, followed by lipidation of liver and the onset of NAFLD (8). Unrestricted obesity usually degenerates the progression of the inflammatory process of the liver resulting in more chronic diseases such as cirrhosis and hepatocellular carcinoma (23). In other words, obesity is an independent, dose dependent risk factor for NAFLD, thus early interferences to avoid overweight are crucial.
This study demonstrated that waist circumference had no effect on liver fat accumulation, which contradicted with previous studies (23,26,27). Their studies reported higher percentage of visceral fat is generally associated with an increased risk of metabolic syndrome, cardiovascular event, and NASH. Moreover, waist circumference was reported to be a stronger predictor of visceral fat when compared to BMI, and even there was a 1% increase in visceral fat, it escalated the risk of liver fibrosis by more than threefold in both children and adults. The visceral fat distribution mostly can cause metabolic disorders when compared to subcutaneous fat and normally happen to men (25). The absence of correlation between waist circumference and liver fat accumulation in the current study might be due to sampling bias as the measurements were collected by different staff in charge of MRI on the scanning day. No specific fixed landmark was also used in the sampling measurement. Besides, the sample population size was too small and may be insufficient for the data to accurately correlate between waist circumference and hepatic fat content. In addition, hip circumference and waist-hip ratio were not included in this study.
There was evidence of positive correlation between ALT and with USG grading and all three MRS STEAM, MRS PRESS and MR-PDFF, indicating elevated ALT can lead to an increase level of liver fat content. Similar evidence found in several studies represented that patients’ with NAFLD had high hepatic enzymes (ALT) implying liver injury (24,25,28). Then, further elevation of ALT and Aspartate aminotransferase (AST) levels can be spotted in NASH progression (5). The diagnosis of NAFLD using a cut-off value of >30 U/L for serum ALT is considered a good specificity (80%) but poor sensitivity (42%). Moreover, the use of ratio AST to ALT (AST/ALT) proved to be a good predictor in the presence of advanced liver fibrosis. Therefore, these parameters are effective enough in detecting NASH related cirrhosis and evaluating the progress of decompensated liver disease. Moreover, the accuracy of MRI fat fraction and MRS among patient with increased transaminase concentrations of unknown cause could be useful in diagnosis of hepatic steatosis (21).
This study was performed on patients with severe obesity and have high risk for developing NASH. The sensitivity and specificity of ultrasound assessment is limited by their body habitus. Therefore, utilisation of MRI in these patients will be beneficial in assessment of fatty liver and its complications. This study recommends MRS STEAM, MRS PRESS and MR-PDFF quantifications compared to USG grading of NAFLD in obese patients. The accuracy and precision of MRI with MRS are better, non-invasive method and provide straightforward quantitative measurements to investigate hepatic fat. Moreover, the effectiveness of MRS could have an important role in the early detection of lipid content and monitors the response to treatment. The MR techniques are practical for hepatic steatosis grading in general populations (1,29,30). The present research only focused on presence of NAFLD in obese patients due to the increased rate of obesity in Malaysia and successfully proved that MRI with MRS can be practically used to diagnose NAFLD in obese populations. Although the implementation of MRS was limited just to clinical trials and research studies because of user expertise, the continuity of validation and refinement of instrument and acquisition technique can lead to incorporate the application of MRS into clinical routine.
Conclusion
In conclusion, higher BMI increased the severity of hepatic steatosis in USG, MRS PRESS and MR-PDFF, but MRS STEAM showed no correlation with BMI. There was also positive association of ALT with fat liver accumulation, where elevated ALT associated with increased steatosis in USG, MRS STEAM, MRS PRESS and MR-PDFF. Therefore, BMI and ALT may be used as biomarkers in predicting fatty liver.
Limitations
The first limitation was the collected data came from one hospital in Malaysia. Secondly, the study was conducted during the COVID pandemic in Malaysia. Hence, there were limited patients and access to ultrasound due to safety reason. This resulted in the small sample size in this study. Moreover, the analysis was based on BMI and waist circumference with no evaluation on other risk factors of NAFLD such as age, gender, race, and diabetes mellitus. Due to cost constrain, routine biochemical parameters such as AST and Gamma Glutamyl Transferase (GGT) were not performed, which can be good predictors of NAFLD.
MRS spectra was only taken through a single voxel technique, which was placed in segment VII of liver. Additionally, multivoxel spectroscopy was not performed because it took longer acquisition time and increased distance from coil to body. Finally, despite liver biopsy is the gold standard to diagnose NAFLD, this invasive procedure was not allowed to be performed due to restrictions during the COVID 19 pandemic. Thus, there was no internal comparison between liver biopsy histological and MRS and MRI data.
Recommendations
Future studies need to have larger sample sizes and involve different healthcare institutions. Other variables such as age, gender, and presence of diabetes mellitus should be included into the investigation criteria. Future researchers need to try localising voxel placement in every lobe of liver in MRS and get an average value (as performed in our MR-PDFF) to permit quantification of lipid fraction of the whole liver. Until now, there has been no standard reference point for MRS spectroscopy grading of NAFLD in the market thus, to have a study in defining the cutoff parameters to grade the liver fat infiltration in MRS is an option.
Acknowledgement
This study was supported by the Putra Grant (GP-IPM: 9641200) from Universiti Putra Malaysia.
Conflict of interest
There was no conflict of interest in this manuscript.