Document Type : Original article
Abstract
Background: Assessing reflective performance in medical students is a crucial initial step in devising effective educational strategies for its enhancement. Current reflection scales in Iran fall short, primarily because they do not adequately address students’ willingness and inclination to engage in reflective practices. This study aimed to test psychometric properties of Reflective Performance Questionnaire (RPQ) among medical sciences students in Iran.
Methods: This cross-sectional study was conducted in Tabriz University of Medical Sciences students (n=245). The RPQ underwent translation from English to Persian through a translation and back-translation process. The psychometric properties of the RPQ were done by using face, content, and construct validity, and reliability. The construct validity was done using Exploratory Factor Analysis (EFA) on 245 students. The reliability of the RPQ was also checked with two approaches of internal consistency and stability.
Results: The content validity indices, namely Content Validity Index (CVI) and Content Validity Ratio (CVR), were deemed satisfactory with values of 0.93 and 0.74, respectively. The EFA revealed a single factor containing 40 items explained more than 33% of the total observed variance. The reliability test revealed that the Cronbach’s alpha coefficient (equal to 0.89) and the Intra-class Correlation Coefficient (ICC) indicated satisfactory internal consistency equal to 0.89 (95%CI=0.87–0.91) for the tool.
Conclusion: This study confirmed that the Persian version of the “Reflective performance Scale” is a reliable and valid instrument to evaluate reflective performance in medical students within Iran. The structure of the dimensions obtained in this study was consistent with the structure of the original scale.
Keywords: Cognitive reflection, Factor analysis, Psychometrics, Reproducibility of results, Statistical, Surveys and questionnaires
Introduction
Reflective practice is a pervasive phenomenon in various professional domains, serving as a deliberate process to foster continuous learning (1). This method entails a proactive engagement with one’s knowledge and beliefs, involving a reflective examination of personal and shared experiences to attain a profound understanding and heightened awareness (2). The practice of consciously reflecting on theoretical knowledge and practical experiences holds significance across diverse disciplines (2). In 1984, Kolb emphasized the essence of experiential learning, illustrating how physicians actively reflect on their experiences, thereby generating new knowledge over time. Subsequently, the concept of reflective practice has evolved and found application in numerous fields, including health and medicine, business, and management (3).
Moreover, in interdisciplinary domains such as children’s mental health, reflective practice has been integral since the 1990s, notably in the cultivation of supportive and nurturing relationships as a primary component. Acquiring the skill of reflective practice often extends beyond inherent traits and is commonly fostered within the framework of regular, collaborative, and secure supervisory relationships (4-6). Reflective practice, characterized by a partnership or collaborative group where one individual typically possesses more experience without exerting special authority, is frequently of a multidisciplinary nature (7).
The Reflection Performance Questionnaire (RPQ), initially developed by Priddis et al in 2017 (1), was later applied by Rogers (8) among medical students in 2019. The findings from this study indicated that medical students reported higher levels of reflective performance compared to their peers. Reflective performance among medical students was found to be linked to factors such as self-confidence, stress, and a desire for improvement. Job satisfaction demonstrated a positive correlation with self-confidence and a negative association with stress during patient interactions. The validity measurement of the reflective performance assessment tool, indicated by Cronbach’s alpha value of 0.84, demonstrated the requisite validity (8).
The reflective performance questionnaires hold potential utility as components of post-teaching evaluations in medical education initiatives, as supplements to self-reflective activities within the curriculum, and as tools for identifying individual students’ strengths and areas for improvement. Ooi et al (9) conducted a review study explored reflective performance tools among healthcare professionals, examining articles published in English from 1998 to 2018. The study evaluated eighteen articles, discussing the strengths and weaknesses of the measures based on a proportional critical appraisal checklist. Overall, all instruments reviewed were deemed potentially applicable to healthcare professionals or health science programs with some adjustments. Despite limited evidence for alternative measurement scales, the RPQ was recommended for assessing reflective practice in healthcare settings.
The RPQ has been scrutinized for its psychometric properties, particularly among medical students. Lee et al conducted a study in Korea, determining that the Korean version of the RPQ (K-RPQ) is a reliable and valid tool for assessing the level of reflection among Korean medical students during clinical practice (10). Rogers et al also explored the RPQ in medical students and established its reliability as a measure of reflective capacity, with a Cronbach’s alpha value of 0.84 for reflective capacity (11). These findings highlight the RPQ’s utility in assessing reflection levels among medical students and its potential integration into medical education programs to complement students’ self-reflection activities and identify those who may benefit from targeted interventions.
Given its importance in developing expertise in medicine, reflective practice has become a noteworthy aspect of medical education (8). Teaching students to apply reflective practices is increasingly considered a goal in medical education, as reflection plays a crucial role in establishing therapeutic relationships between doctors and patients, contributing to the development of future professional practice (12). The RPQ can serve as a valuable tool for assessing self-reported measures of experiences, benefits, and potential challenges associated with reflective practice and reflective supervision across various service industries, including psychology, nursing, and education.
Assessing reflective performance necessitates a robust and valid structure (1) to continually appraise and scrutinize outcomes. Notably, despite an extensive inquiry, no standardized questionnaire has been identified for the evaluation of this pivotal aspect in medical education. Therefore, this study seeks to investigate the validity and reliability of the RPQ among students enrolled in specialized and advanced courses at Tabriz University of Medical Sciences.
Materials and Methods
Type of study
This research constitutes a descriptive study aimed at assessing the validity and reliability of the RPQ among graduate students at Tabriz University of Medical Sciences.
Participants and study design
The statistical population for this study comprises graduate students from Tabriz University of Medical Sciences during the academic year 2018-19. A random cluster sampling method was employed, resulting in a sample size of 245 students selected from various faculties. The inclusion criteria comprised postgraduate or medical students enrolled at Tabriz University of Medical Sciences, while the exclusion criteria included individuals without consent to participate and medical students who had not completed basic sciences. Informed written consent was obtained from all participants. The study received ethical approval from the Ethics Committee of Smart University of Medical Sciences (IR.SMUMS.REC.1402.028).
The sample size was determined as 5-10 individuals per questionnaire item, leading to a total research population of 200 people based on the questionnaire’s 40 items (11).
Research tool
The RPQ, initially developed by Priddis, consists of 40 questions across ten dimensions. These dimensions encompass Reflective-in-Action (RiA), Reflective-on-Action (RoA), Reflective with Others (RO), Self-Appraisal (SA), Desire For Improvement (DFI), Confidence-General (CG), Confidence Communication (CC), Uncertainty (Unc), Stress interaction with Clients (SiC), and Job Satisfaction (JS). The questionnaire employs a six-point Likert scale ranging from completely agree (6) to completely disagree (1).
The procedure of translation and back translation
The procedure of translation and back-translation involved several key steps to ensure the linguistic accuracy and cultural relevance of the RPQ for the target population. First, formal permission from the original questionnaire designer to translate the RPQ into Persian was obtained. Next, a qualified and experienced translator fluent in both English and Persian translated the questionnaire into Persian. The translator rendered the RPQ content from English into Persian, paying careful attention to maintain the intended meaning and cultural nuances. After that, a proficient English language professor, with expertise in the subject matter, was selected for the back-translation process. In the next step, the Persian version of the RPQ was then translated back into English by the language professor. This step aimed to identify any discrepancies, ambiguities, or cultural misalignments that might have occurred during the initial translation. Finally, the back-translated English version was meticulously compared with the original English RPQ to identify any disparities. Ambiguities or linguistic nuances were carefully addressed, ensuring that the translated version accurately reflected the intended meaning of the original questionnaire (13).
Face validity: quantitative and qualitative
Qualitative face validity was implemented as part of the study. Face-to-face interviews with 10 students was conducted to assess difficulty, appropriateness, and ambiguity. Five experts in medical and health education for qualitative face validity assessment, focusing on terminology, item allocation, grammar, and scaling. This assessment led to some changes in the wording of the RPQ. In order to assess quantitative face validity, the identical group of 10 students were asked to assess the significance of each instrument item using a Likert scale ranging from option 1, indicating “unimportant,” to option 5, denoting “very important.” Subsequently, the importance score for each tool item was computed using the formula (importance score * frequency). To establish the quantitative formal validity of each item, it was required that its effect score should not fall below 1/5. Consequently, only questions with a score exceeding 1/5 were deemed acceptable in terms of quantitative formal validity (14).
Content validity: qualitative and quantitative
Qualitative validity was done by following thorough examination of the tool. Experts were solicited to share their insights concerning the overall content quality, including the content of each items. Their feedback, encompassing opinions on the tool’s content and item specifics, was carefully considered, leading to modifications and subsequent application of their valuable input to refine the tool.
For evaluation of quantitative content validity, Content Validity Index (CVI) and Content Validity Ratio (CVR) was used. The CVI appraised by the panel using four-point scale: 4=very relevant, 3=relevant with some revisions to wording, 2=only relevant weather the questionnaire is significantly revised, and 1=irrelevant. If any panel member assigned a rating of less than 4 to a question, they were requested to suggest modifications. In accordance with the World Health Organization (WHO) guidelines, a CVI score exceeding 0.79 was considered indicative of content validity (15,16). To ensure face validity and enhance clarity, the pre-final version of the questionnaire underwent assessment by 10 medical students who met the study’s eligibility criteria. Ultimately, no questions were omitted, maintaining the original length of the Persian model. The CVR determined by expert opinions on item necessity. Established criteria for acceptable CVI (Unacceptable: <0.71; Revision Needed: 0.72< CVI <0.79; Acceptable: >0.79) (14).
Construct validity:
Exploratory Factor Analyses (EFI) was employed to assess construct validity. The Kaiser-Meyer-Olkin (KMO) measure and Bartlett’s test of sphericity were used in order to assess the sampling adequacy of the factor analysis. Any factor with an eigenvalue equal to one or above was considered significant for factor extraction. Where the loading criterion was 0.3 or more, a Principal Axis Factoring (PAF) analysis was used for extraction in the factor analysis.
Reliability
To assess the internal consistency of the questionnaire among students, the Cronbach’s alpha coefficient was calculated. The instrument demonstrated an internal consistency exceeding 0.7. This method provides an estimate of the correlation between variables constituting the intended structure or scale. Cronbach’s alpha coefficient serves as a standard measure for reliability in this approach. A value of zero for this index signifies the unreliability of the intended scale, while a numerical value of 1 indicates its complete reliability.
The scale’s stability over time (test-retest reliability) was assessed using the Intra-Class Correlation index (ICC). The ICC was computed using a two-way mixed effects model with a 95% confidence interval. A group of 20 participants completed the questionnaires, and after a twenty-day interval, the same individuals completed the questionnaires again. An ICC value equal to or less than 0.4 is considered weak, 0.6-0.4 is considered average, 0.8-0.61 is considered good, and anything exceeding 0.8 is deemed excellent. In general, an ICC higher than 0.7 falls within the acceptable range (17).
Statistical analysis
The statistical analyses were conducted using SPSS for Windows version 23.0 and the Stata package. Descriptive statistics were computed to summarize the main features of the data, including means, standard deviations, and frequencies. To assess the relationships between variables, Pearson correlation coefficients were calculated.
Results
Table 1 provides an overview of the average age and educational distribution within the sample of students categorized by gender. It offers insights into the composition of the study population, highlighting differences in age and educational backgrounds between females and males. The overall average age is 27.6 years with a standard deviation of 4.4. Table 2 shows the Mean (SD) scores of sub-dimensions. Table 3 presents the correlation analysis of sub-dimensions within the RPQ. Each cell in the table displays the correlation coefficient between the corresponding pairs of sub-dimensions.
Table 1. Demographic characteristics of participants
|
|
Female(n=165) |
Male(n=80) |
Total |
|
Age (years) Mean (SD) |
27.65(4.1) |
27.63(5.04) |
27.6(4.4) |
|
The level of education |
N(%) |
N(%) |
N(%) |
|
Master of sciences |
61(36.9) |
25(31.2) |
86(35.1) |
|
Medicine |
78(47.2) |
43(53.7) |
121(49.4) |
|
Professional degree |
26(51.7) |
12(15) |
38(15.4) |
Table 2. The Mean (SD) and Cronbakh’s Alpha scores for sub-dimensions of RPQ
|
Sub dimensions of reflective performance questionnaire |
Mean (SD) |
Cronbach’s alpha |
|
Reflective-in-action |
3.79(0.92) |
0.92 |
|
Reflective-on-action |
4.1(0.76) |
0.87 |
|
Reflective with others |
3.8(0.8) |
0.91 |
|
Self-appraisal |
3.8(0.57) |
0.88 |
|
Desire for improvement (DFI) |
4.1(0.8) |
0.90 |
|
Confidence–general (CG) |
3.8(0.57) |
0.86 |
|
Confidence–communication (CC) |
3.9(0.54) |
0.93 |
|
Uncertainty (UNC) |
3.9(0.48) |
0.89 |
|
Stress interacting with clients (SIC) |
3.8(0.89) |
0.88 |
|
Job satisfaction |
3.6(1.0) |
0.90 |
|
Total score |
- |
0.89 |
Table 3. Correlation analysis of sub-dimensions of RPQ
|
|
RIA |
ROA |
RO |
SA |
DFI |
CG |
CC |
UNC |
SIC |
JS |
|
RIA |
1 |
|
|
|
|
|
|
|
|
|
|
ROA |
0.714** |
1 |
|
|
|
|
|
|
|
|
|
RO |
0.693** |
0.674** |
1 |
|
|
|
|
|
|
|
|
SA |
0.847** |
0.812** |
0.594** |
1 |
|
|
|
|
|
|
|
DFI |
0.597** |
0.790** |
0.714** |
0.612** |
1 |
|
|
|
|
|
|
CG |
0.532** |
0.496** |
0.710** |
0.486** |
0.617** |
1 |
|
|
|
|
|
CC |
0.206** |
.376** |
0.274** |
0.328** |
0.493** |
0.512** |
1 |
|
|
|
|
UNC |
0.359** |
0.327** |
0.425** |
0.338** |
0.415** |
0.581** |
0.527** |
1 |
|
|
|
SIC |
0.289** |
0.364** |
0.261** |
0.378** |
0.285** |
0.331** |
0.339** |
0.434** |
1 |
|
|
JS |
0.424** |
0.487** |
0.382** |
0.390** |
0.382** |
0.284** |
0.219** |
0.318** |
0.623** |
1 |
** Correlation is significant at the 0.01 level.
Face validity
In both qualitative and quantitative models, each item demonstrated an impact factor surpassing 1.5, confirming the appropriateness of all 40 items for further analysis.
Content validity
The content validity indices, namely CVI and CVR, were deemed satisfactory with values of 0.93 and 0.74, respectively.
Construct validity
The recorded KMO value was 0.821, and Bartlett’s test of sphericity yielded a significant result (χ2 =8398.999, p<0.001), affirming the adequacy of the data for conducting factor analysis. This indicated a substantial correlation among the variables, establishing the data’s suitability for the intended analysis.
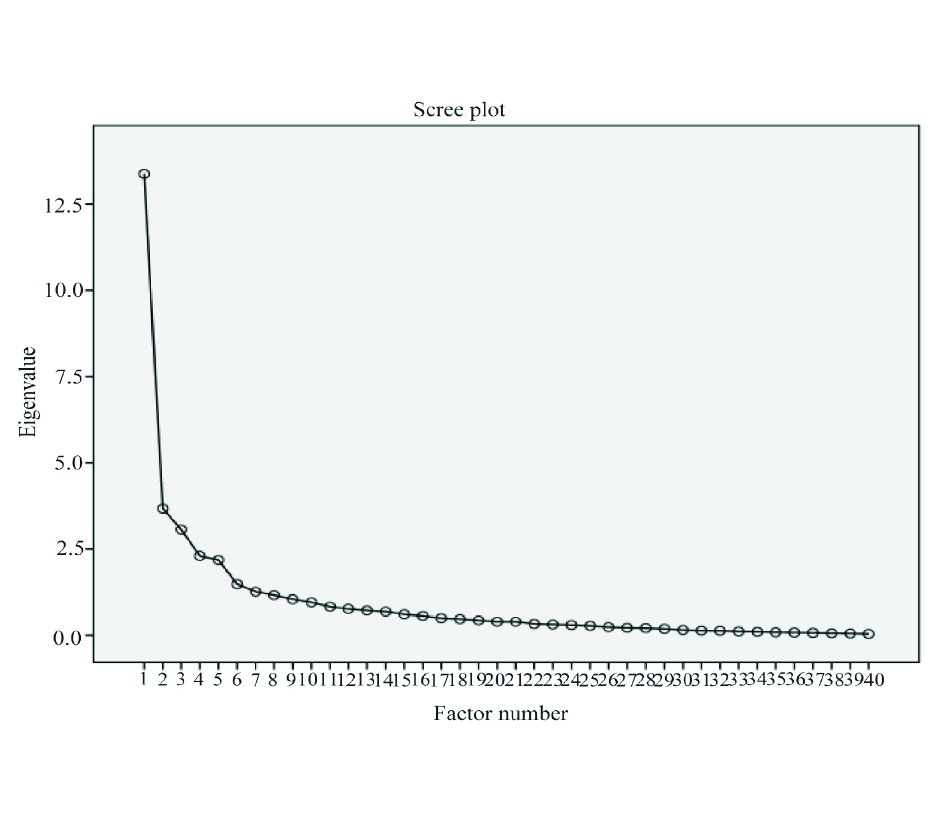
To extract a factor, the PAF analysis method was employed. The analysis revealed an eigenvalue of 0.300 for item numbers in the extraction column, signifying that only 32% of the variance in item number 40 scores represented common factor variance. The scree plot showed a factor solution (Figure 1). Content of a factor and items in this analysis was shown in table 4.
Table 4. Loading the eigenvalues of items in Exploratory factor analysis (n = 245)
|
Items |
Factor |
|
RiA3 |
0.744 |
|
ROA3 |
0.729 |
|
DFI3 |
0.710 |
|
DFI2 |
0.708 |
|
SA4 |
0.707 |
|
ROA4 |
0.703 |
|
ROA2 |
0.697 |
|
DFI1 |
0.668 |
|
SA2 |
0.642 |
|
ROA1 |
0.640 |
|
RO3 |
0.635 |
|
RiA4 |
0.625 |
|
CG2 |
0.625 |
|
SA1 |
0.623 |
|
RiA1 |
0.615 |
|
SA3 |
0.613 |
|
RO1 |
0.609 |
|
RiA2 |
0.605 |
|
RO4 |
0.603 |
|
JS3 |
0.588 |
|
RO2 |
0.586 |
|
DFI4 |
0.574 |
|
CG1 |
0.569 |
|
JS1 |
0.545 |
|
SIC3 |
0.509 |
|
JS2 |
0.506 |
|
JS4 |
0.498 |
|
CC1 |
0.485 |
|
Unc1 |
0.469 |
|
SIC1 |
0.468 |
|
SIC2 |
0.431 |
|
CC3 |
0.421 |
|
CC4 |
0.421 |
|
CG3 |
0.420 |
|
SIC4 |
0.416 |
|
Unc4 |
0.381 |
|
Unc3 |
0.347 |
|
Unc2 |
0.309 |
|
CG4 |
0.300 |
|
CC2 |
0.300 |
Reliability
Table 2 presents Mean (SD) and Cronbach’s Alpha coefficients of sub-dimensions of the RPQ which indicate the internal consistency or reliability of each sub-dimension.
To assess internal consistency, Cronbach’s alpha was employed. The calculated Cronbach’s alpha coefficient for the RPQ stood at 0.89, signifying strong internal reliability. The subscale values for sub-dimensions were presented in table 1. A test-retest analysis was performed to evaluate the stability of the RPQ, yielding satisfactory results. The ICC was found to be 0.89 (95% CI = 0.87–0.91).
Discussion
This study aimed to investigate psychometric properties of RPQ among medical students in Tabriz University of Medical Sciences. The current study has offered initial evidence supporting the usefulness of the questionnaire among medical sciences students in Iran. The findings offer evidence that the RPQ comprises internally consistent items, effectively assessing domains of reflection pertinent to reflective practices in health care work settings.
A study from Iran investigated reflective capacity questionnaire by selecting 16-items with four domains among medical students in Tehran (18). Their results indicated that the translated scale, consisting of 16 items, demonstrated acceptable face and content validity. Exploratory Factor Analysis (EFA) revealed four factors explaining 63.79% of the total variance. Overall, the study provided evidence for the appropriateness and reliability of the Reflective Capacity Scale in assessing reflective abilities among medical students in a Persian-language context. The four factors including “reflection during performance”, “reflection after performance”, “reflection with others”, and “active self-evaluation” were addressed in the study. A complete version of RPQ with ten dimensions and based on the findings and recommendations from Priddis and Rogers were examined, adjustments were made to incorporate a factor for all dimensions of the scale (8). This study which is inconsistent with the present study finds that the EFA on the RPQ items reveals four distinct factors rather than a single factor, suggesting that the questionnaire might measure more than one underlying construct.
The analysis of the data yielded an eigenvalue of 0.300 for item numbers in the extraction column, indicating that only 32% of the variance in the scores of item number 40 could be attributed to common factor variance for a factor loaded in the EFA for the PRQ questionnaire. This suggests that item number 40 might not strongly align with the underlying factor structure identified through the EFA process. The findings of the present study are parallel to those of a separate study that investigated the psychometric properties of the Swedish version of the RCS-RPQ. This study also affirmed the presence of a single component for the RPQ scale, with factor loadings exceeding 0.3. In that study, the single component accounted for 44.65% of the total variance, indicating a substantial portion of variance captured by the identified factor (19).
A study by Bass et al (20) aimed to develop and validate a tool for assessing holistic reflection in midwifery students and midwives, applicable to both pre-registration and postgraduate education, as well as research. They followed an eight-step approach and develop a tool with emotional intelligence subscale and a social desirability scale. Results from 187 responses indicated a three-factor structure, explaining 49% of the variance, with high internal consistency (α=0.91) and stable test-retest reliability at two weeks (α=0.93).
Scale reliability was assessed by computing inter-item correlations and Cronbach’s alpha values. Following the criteria outlined by Nunnally and Bernstein (21), an alpha value exceeding 0.70 is considered acceptable, over 0.80 is deemed good, and surpassing 0.90 is regarded as excellent. Adhering to these benchmarks, the Cronbach alpha values for the all dimensions exhibited goodness (>0.80). In the present study robust positive correlations were found among the reflection-in-action, reflection-on-action, reflection with others, and self-appraisal sub-components.
It is advisable for future studies to broaden the participant to encompass diverse groups of medical students, varying in demographics, academic levels, and clinical experiences. By incorporating a wider spectrum of students, researchers can obtain a more comprehensive understanding of the psychometric properties across different subgroups, ensuring the generalizability of the findings. Conducting longitudinal studies is essential for gaining valuable insights into the stability and evolution of reflective performance over time, particularly within medical education contexts. By assessing students’ reflective abilities longitudinally, researchers can track developmental trajectories and identify factors influencing reflective growth. Furthermore, it is imperative to undertake cross-cultural validation studies to ensure the applicability and reliability of the reflective practice questionnaire across different cultural contexts. Considering cultural nuances is crucial for enhancing the validity of any psychometric instrument. Therefore, researchers should prioritize cross-cultural validation efforts to validate the questionnaire’s effectiveness across diverse cultural backgrounds.
Conclusion
In general, this study demonstrated satisfactory psychometric properties for the tool, with the CVI and CVR indicating good content validity. Additionally, EFA results revealed a robust and well-defined structure. This study confirmed that the Persian version of the “Reflective performance Scale” is a reliable and valid instrument to evaluate reflective performance in medical students within Iran. The structure of the dimensions obtained in this study was consistent with the structure of the original scale.
Limitation
This research conducted among master’s and doctoral students at Tabriz University of Medical Sciences, warrants careful consideration when generalizing findings to specialized groups across different faculties. Despite demonstrating acceptable levels of validity and reliability, caution is advised in interpreting the study’s conclusions. Variations in sex ratio and demographic traits may introduce potential biases into the findings. Additionally, the self-report format used to assess reflective performance may lead to respondent fatigue due to the questionnaire’s length, potentially compromising the accuracy of student responses.
Conflict of Interest
The authors declared no conflict of interest.