Document Type : Original article
Abstract
Background: Kidney diseases are prevalencing rapidly and -nutri tional transition has increased the Dietary Acid Load (DAL) of diet and thus exacerbating the metabolic disorders. The goal of the study was to determine the association the DAL of the diet with certain renal function indices in Chronic Kidney Disease (CKD) patients.
Methods: In this cross-sectional study, 90 CKD patients were recruited. The DAL index, including the Potential Renal Acid Load (PRAL), Net Endogenous Acid Production (NEAP), and Net Acid Excretion (NAE) was calculated using data from a Food Frequency Questionnaire (FFQ) and adjusted for energy variables. Ultimately, their correlation with anthropometric and biochemical indices, such as Glomerular Filtration Rate (GFR) and Creatinine (Cre) was estimated.
Results: Median and Interquartile range (IQR) of DAL for participants was 13.9(8.9-20.9), 47.1(39.3-52.12) and 55.8(50.16-61.9) mEq/day for PRAL, NEAP, and NAE, respectively, with a strong correlation (p<0.001) among them. Age (p<0.05), total daily energy intake (p<0.05), percentage of protein and carbohydrates from energy (p<0.05), and GFR (p<0.05) were significantly higher in the third tertile compared to the T1 group of DAL indexes. However, Blood Urea Nitrogen (BUN) (p<0.05) and Cre (p<0.05) were lower.
After adjustment in the General Linear Model, the Mean difference (MD) of GFR and Cre became nonsignificant. Nevertheless, in the crude model, the MD of GFR and Cre were significant (p<0.05).
Conclusion: By adjusting the effect of confounding variables, DAL indics of CKD patient did not show significant correlation with renal function. Long-term studies involving larger populations and consideration of confounding factors are recommended.
Keywords: Dietary acid load, Glomerular filtration rate, Kidney
Introduction
Today, Chronic Kidney Disease (CKD) is recognized as international public health problem (1). In addition to racial and genetic susceptibility, different risk factors such as hypertension, diabetes and lifestyle can predict the incidence of CKD (2,3). According to various studies, this disease affects from 8% to more than 16% of adults (2,4). This non-communicable disease can lead to cardiovascular morbidity, pulmonary hypertension, infection, periodontal disease, depression, dialysis, renal replacement and evently mortality (5-10). It has been shown not only in advanced stages, but in early stages of renal dysfunction, morbidity and even mortality are high (11) and taking care of this disease involves a lot of economic costs. So, preventing its modifiable risk factors such as diet can be effective in reducing costs and increasing life expectancy (12,13).
Proteins from meat, fish, eggs, cereals, and dairy products (14) are major source of nonvolatile acid and metabolized to sulfates and other organic acids; while fruit and vegetables have natural potassium salts that induce alkaline condition in the body (15). High Dietary Acid Load (DAL) increases ammonium concentration and hydrogen ions excretion in kidney tubules; so these pathophysiological mechanisms, enhances activity of the renin-angiotensin system and aldosterone, causing tubular toxicity, destruction of renal nephrons and decreased renal function in the long term period (11,13). DAL is measured by Potential Renal Acid Load (PRAL) and Net Endogenous Acid Production (NEAP) indices which are based on dietary intakes of protein, calcium, magnesium, potassium and phosphorous (16). A part of the acid excreted by the kidneys can be considered equivalent to PRAL and a part as Organic Acid (OA), dependent on the body surface and permanently, excreted from the kidneys (17). Considering the inappropriate dietary pattern in Iran, characterized by low consumption of fruits and vegetables and high consumption of cereal and meat based foods, it is predictable that the Iranian diet will increase the acid load and thus exacerbate metabolic disorders (18). This diet, which is mostly the result of nutritional transition, may be associated with an increase in the acidic load of the diet and thus the aggravation of metabolic disorders. This condition poses a greater risk for kidney patients, because they are often restricted in consuming alkaline foods.
Moreover, from limited researchs on the relationship between dietary acidity and kidney function (1,19), PRAL and NEAP were estimated and their association with sociodemographic and biochemical factors in CKD patients referring to a general hospital, southwest of Iran, were evaluated.
Materials and Methods
Population and study design
In this cross-sectional study, 90 CKD patients with Glomerular Filtration Rate (GFR) 20-65 ml/min (20) were enrolled by easy and accessible sampling method in 2018. The protocol of this study underwent review and was approved by the Ethics Committee of Yasuj University of Medical Sciences 1(Ethical code: IR.YUMS.REC.1396.29). Exclusion criteria included acute or chronic inflammatory disease, malignancy or known hematological disorder and recent severe hemorrhagic episode. Patients were informed of the study goals and written consent was obtained. Participant must be at least 20 years of age. Self-reported socioeconomic status (SES) was obtained during their interviews. In this study all patients-both women and men-participated.
The weight of participants was measured with light clothing using a standard scale (Seca786, Germany) with 0.1 kg accuracy. Patient’s height was also measured while standing without shoes using no elasticitic gauge plate (Seca786, Germany) with 0.5 cm accuracy. Body Mass Index (BMI) was calculated as weight (kg) divided by squared height (m2). BMI was categorized into four groups: lean (<18.5 kg/m2), normal (18.5-24.9 kg/m2), overweight (25-29.9 kg/m2) and obese (≥30 kg/m2) (7). Dietary intake was assessed using a semi-quantitative standard Food Frequency Questionnaire (FFQ) (14,19). The Cronbach’s alpha coefficient for FFQ was 0.932, indicating higher validity and reliability than the cut of point of 0.7. Thus, the FFQ demonstrated very good validity and reliability. It was completed by a trained nutritionist during an interview with the patient, while explaining the standard units related to different types of foods. The amount and frequency of consumption of food items were recorded as daily, weekly, monthly and seasonal. It should be noted that units for each item were standard units; For example, a 240 ml cup for milk; an average of 100 g was considered as one unit of apple. For different types of bread, scale was the palm of the hand (10×10 cm cut). Consumption of each food item was converted in to g/day using the illustrated guidebook of home scales. Since, most fats are consumed as cooking oil in Iran, a separate question was included in the questionnaire; “How much (in kg) of cooking oil is bought for your household? How long is it generally enough?”. Then, by knowing the number of household members, the approximate daily consumption of edible oil for each person was calculated. Macronutrient and micronutrient content of each food was extracted using the Iranian food composition tables. Blood samples were taken from patients after 12-14 hours of overnight fasting by an experienced nurse and biochemical tests was performed using the enzymatic colorimetric kits (Bionic Kit, Iran). Blood pressure was also measured using a standard mercury sphygmomanometer (DDM, Inc, Castelculier, France) after hospitalization and 15-minutes of rest in seated position.
Definitions
DAL was calculated using the Remer and Manz equation (20):
PRALmEq/day = 0.49*protein + 0.037* phosphorus − 0.021*potassium − 0.026*magnesium − 0.013*calcium NEAPmEq/day=54.5*(Pro:K)-10.2
Net Acid Excretion (NAE)mEq/day= PRALmEq/day+41*Body Surface Area (m2)/1.73m2.
The higher the estimated values of these variables, the higher the acidity of the diet.
Body surface area was calculated using Mosteller formula (21). GFR was calculated from the Cockroft formula (22) or GFR = (140-age) *Weight/PCre *72
PCre: Plasma concentration of Cre
Because intakes of most nutrients are associated with energy intake, and differences in total energy intake can result in extraneous variation in nutrient intake, energy adjustment is necessary for correct diet and disease correlation interpretation; thus, daily intake of protein was calculated as proportionated to 15% kcal from protein. The nutrient density of phosphorus, potassium, magnesium and calcium was calculated as intake (g or mg)/1000 kcal (23).
Diabetes mellitus was defined as having Fasting Blood Sugar (FBS) level of ≥126 mg/dL or taking blood sugar-lowering drugs. Hypertension is defined as office systolic Blood Pressure (BP) ≥140 mmHg and office diastolic BP ≥ 90 mmHg, which is equal to either 24 hr mean Ambulatory Blood Pressure Monitoring (ABPM) ≥130/80 or Home Blood Pressure Monitoring (HBPM) ≥135/85 mmHg (19). Blood Urea Nitrogen (BUN) >40 mg/dL was considered as high BUN concentration, while albumin concentration <2.5 g/dL was categorized as marked hypoalbuminemia. Mild hypoalbuminemia was defined as a concentration of 2.5-3 g/dL, and the normal range was considered to be 3.6-4.5 g/dL (24).
Statistical Analysis
All statistical analyses were conducted using SPSS 26 (IBM Corp, Armonk, NY, USA). Normality of variables was assessed using the Kolmogorov–Smirnov test. Continuous variables were presented as the mean (M)±standard deviation (S.D) for normal distribution and as median and Interquartile Range (IQR) for skewed distribution, while categorical ones as absolute and relative frequencies. Correlation analysis across tertiles of PRAL, NEAP and NAE indices was done using the χ2 test for categorical variables and One-way ANOVA and Kruskal–Wallis tests for continuous variables. The Mean Differences (M.D) of the main dependent variables (GFR and Creatinine (Cre) concentration as indicators of kidney function) were compared across the tertiles of independent variables (PRAL, NEAP and NAE indices) using Univariate general linear model test in both crude model and the adjustment model (confounding variables included age, gender, BMI, daily energy intake, diabetes and hypertension status). p-values less than 0.05 were considered statistically significant.
Results
Median and IQR of DAL for participants were 13.9 (8.9-20.9), 47.1 (39.3-52.12) and 55.8(50.16-61.9) mEq/day for PRAL, NEAP and NAE respectively. There was a high correlation between these indicators: PRAL and NEAP (r=0.433p<0.001), PRAL and NAE (r=833,p<0.001) and NEAP and NAE (r=0.4, p<0.001).52.7% of patients were female. The mean age of patients was 59.93±15.12 years. Median (IQR) of BMI was 24.4(22,28.9) kg/m2. In this study, 44 (48.9%) of the participants had normal weight; 29 (32.2%) of them were overweight and 17 (18.9%) patients were obese. None were underweight. 3.3, 26.7 and 70% of patients had marked hypoalbuminemia, mild hypoalbuminemia and normal albuminuria, respectively. Almost, all of patients had high blood Cre concentration (Cre>1.2 mg/dL); only one patient had normal blood blood Cre 45.5% of patients had high BUN concentration. One patients had GFR >60 ml/min and others had lower GFRs. Demographic, anthropometric, biochemical and blood pressure characteristics of patients across the tertiles of PRAL are presented in table 1. Total daily energy intake (p<0.05), protein and carbohydrate percent of energy (p<0.05) in T3 group were significant higher than T1 group; but intake of food groups with except of grains was lower (p<0.001) in the T3 group. Other variables were not significant between the T3 and T1 groups of the PRAL index. Across the tertiles of PRAL index, the mean GFR increased; BUN and Cre decreased; but not significantly.
According to table-2, the mean age (p<0.05), protein and carbohydrate percent from total energy (p<0.001), daily intake of food groups (p<0.001) and daily intake of energy (p<0.05) were significantly higher in the T3 compared to the T1 group of NEAP. Other variables did not show significant differences.
Table 3 indicates that the mean age (p<0.05), protein and carbohydrate percent from energy (p<0.001) and GFR (p<0.05), were significantly higher in the T3 group of NAE index compared to the T1 group; however, intake of all food groups (p<0.001), BUN (p<0.05) and the Cre (p<0.05) were significantly lower in the T3 group of NAE index compared to the T1 group.
According to table 4, based on general linear model analysis, MD of GFR, in the T3 group compared to the T1 group of all DAL indexes was higher; However, MD of NAE and NEAP were significant only in crude model.
According to table 5, MD of Cre, in the T3 group compared to T1 group of all DAL indices was higher. However, in crude model, mean of Cre concentration of the T3 group compared to the T1 group of NAE and PRAL, was lower (p<0.05); conversely in highest tertile compared to the lowest tertile of NEAP, Cre was higher (p<0.01). Based on adjustment models, MD of the Cre concentration in the T3 group compared to the T1 group of DAL was not significant.
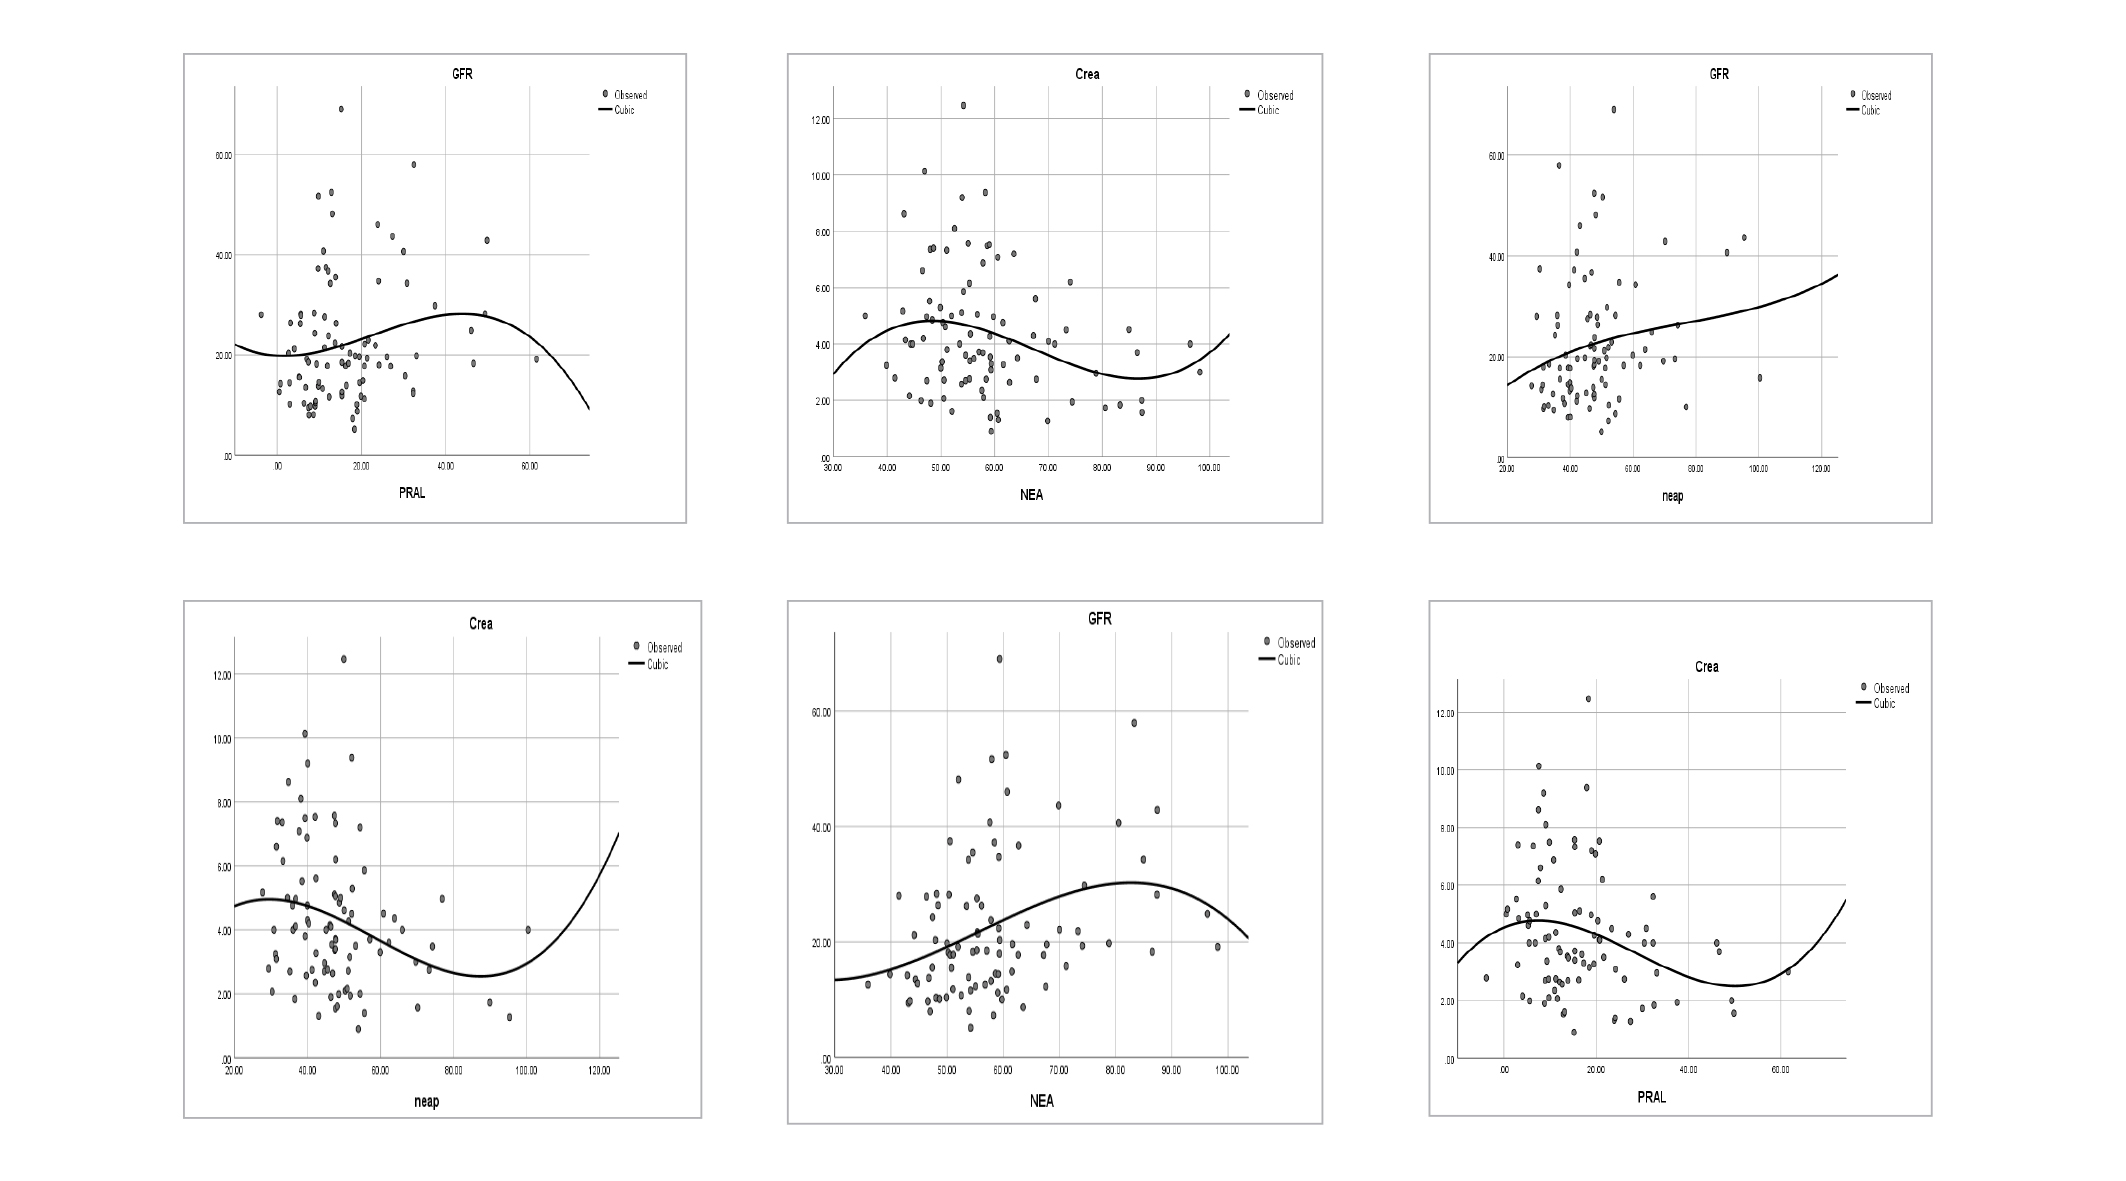
According table-6 the effect of PRAL and NAE on GFR was negative and in other situations of dependent and factor variable, effects were positive, but none of the effects were significant. This correlation was depicted in figure 1. According to this model, the relationship between Cre and all three acid load indices was almost sinusoidal.
Table 1. Characteristics of CKD Patients Based on Tertiles of PRAL
|
Tertile |
Total (-3.8-61.65) |
T1 (-3.8-9.76) |
T2 (9.87-18.48) |
T3 (18.89-61.65) |
p-value |
|
|
Variable |
||||||
|
Demographic & blood pressure |
Age(yr) |
60.15±15.1 |
59.63±17.65 |
55.53±13.61 |
64.63±12.9 |
0.081 |
|
BMI(kg/m2) |
24.4(22,28.9) |
24.2(22.9,29.7) |
24.2(21.9,28.4) |
25.9(21.4,29.3) |
0.544 |
|
|
Gender(M/F) |
43/47 |
15/15 |
13/17 |
15/15 |
0.849 |
|
|
Diabetes [yes(no)] |
29(61) |
10(20) |
8(22) |
11(19) |
0.716 |
|
|
Hypertension [yes(no)] |
70(20) |
24(80) |
23(7) |
23(7) |
0.940 |
|
|
Biochemical |
Na(mg/dL) |
141(139,143) |
141.5(139,143) |
141(139,143) |
140(139,143) |
0.288 |
|
P(mg/dL) |
4.37(3.9,4.8) |
4.4(4,5.02) |
4.5(4.1,4.8) |
4.4(3.2,4.6) |
0.205 |
|
|
K(mg/dL) |
4.25±0.7 |
4.2±0.6 |
4.05±0.63 |
4.5±0.79 |
0.053 |
|
|
Ca(mg/dL) |
8.29±1.54 |
8±1.7 |
8.3±1.6 |
8.5±1.3 |
0.551 |
|
|
Alb(g/dL) |
3.6±0.63 |
3.8±0.57 |
3.6±0.59 |
3.5±0.72 |
0.257 |
|
|
BUN(mg/dL) |
38.5(28,50.5) |
43.6(34.5, 53.4) |
36(28,50.2) |
35.5(28.3,47.5) |
0.549 |
|
|
Cre(mg/dL) |
4(2.74,5.2) |
4.8(3.1,6.3) |
3.6(2.7,5.3) |
3.8(2,4.6)* |
0.056 |
|
|
GFR(ml/min) |
19.1(13.1,27.9) |
15.5(10.4,26.3) |
20.(13.1,34.5) |
19.6(15.6,30.9)* |
0.042 |
|
|
Dietary intake |
Vegetable (g/day) |
37.2±13.7 |
43.5±14.6 |
39.5±9.8 |
28.6±12* |
<0.001 |
|
Dairy food (g/day) |
21.3±8.6 |
26.5±9.8 |
21.7±8.1 |
15. 7±7.5* |
<0.001 |
|
|
Meat(g/day) |
59±22.7 |
70.2±24.1 |
61.3±17 |
45.5±20* |
<0.001 |
|
|
Fruit(g/day) |
42.7±14.5 |
49.6±15.2 |
45±12.3 |
33.6±11.34* |
<0.001 |
|
|
Grains(g/day) |
20.7±8 |
40±7 |
24.5±8.8 |
21±6.2* |
<0.001 |
|
|
Others(g/day) |
240±113 |
292.2±109.6 |
262±127.5 |
167±49.7* |
<0.001 |
|
|
Energy(kcal/day) |
1990.5±577 |
1671±380 |
1877.4±310 |
2422.6±686* |
<0.001 |
|
|
FAT percent (%/E) |
37.5 ±9.2 |
36.5 11.3 |
37.9±9.3 |
37.5±9.2 |
0.793 |
|
|
CHO percent (%/E) |
52.8±12 |
50.01 ±9 |
50.5±7.3 |
57.9±16.5* |
0.023 |
|
|
PRO percent (%/E) |
11.4 ±2.4 |
9.4±2.1 |
11.3±1* |
13.4±2.4* |
0.001 |
|
Values are shown as M±S.D or median (IQR) for continuous variables and frequency (%) for categorical variables. The One Way ANOVA (for age, daily intake of vegetables, dairy foods, meats, fruits, grains and other group, total energy, fat percent of energy, carbohydrate percent and protein percent, blood concentrations of Albumin, calcium and potassium), Kruskal- Wallis H test (BMI, GFR, Blood concentration of Sodium, Potassium, BUN and Cre) and Chi-square test for gender, diabetes and hypertension status was used. Strata(stratified by) variable is diabetes status. *:The mean difference is significant at the 0.05 level compared to T1 group.
Table 2. Characteristics of CKD patients based on the tertiles of NEAP
|
Tertile |
T1 (27.72–40.34) |
T2 (41.26-49.93) |
T3 (50–100.35) |
P-value |
|
|
Tariable |
|||||
|
Demographic& blood pressure |
Age(yr) |
55±13 |
59.1±17.08 |
65.7±13.45* |
0.024 |
|
BMI(kg/m2) |
23.9(21.8,26.8) |
27(23.1,29.8) |
23.8(20.7,27.5) |
0.151 |
|
|
Gender(M/F) |
17(13) |
11(19) |
15(15) |
0.295 |
|
|
Diabetes[yes (no)] |
6(20) |
11(29) |
12(18) |
0.197 |
|
|
Hypertension[yes (no)] |
22(8) |
24(6) |
24(6) |
0.773 |
|
|
Biochemical |
Na(mg/dL) |
140.5(139,143) |
141(139,143) |
141(139,142) |
0.941 |
|
P(mg/dL) |
4.4(4,4.8) |
4.5(4,4.9) |
4.3(3.1,4.7) |
0.744 |
|
|
K(mg/dL) |
4.2±0.5 |
4.2±0.7 |
4.4±0.8 |
0.571 |
|
|
Ca(mg/dL) |
8.3±1.7 |
7.8±1.7 |
8.7±1.3 |
0.179 |
|
|
Alb(gr/dL) |
3.7±0.57 |
3.65±0.55 |
3.5±0.75 |
0.492 |
|
|
BUN(mg/dL) |
45.5(32.7,53.3) |
37.5(28,48.3) |
31.9(23.8,46.3) |
0.743 |
|
|
Cre(mg/dL) |
4.9(3.7,7.1) |
3.6(2.7,5.1) |
3.5(2.1,4.5) |
0.337 |
|
|
GFR(ml/min) |
14.7(11.5,21.3) |
20.7(12.7,30) |
20.8(15.7,30.9) |
0.356 |
|
|
Dietary intake |
Vegetable(g/day) |
39.9±14.6 |
38.8±12.5 |
32.8±13.4* |
0.096 |
|
Dairy food(g/day) |
24.4 ±11 |
21.6±7.9 |
17.9±8.6* |
0.032 |
|
|
Meat(g/day) |
64.8±25.3 |
62±18 |
50.2±22* |
0.038 |
|
|
Fruit(g/day) |
44.9±14.8 |
45.6±13.6 |
37.6±14.3 |
0.0743 |
|
|
Grains(g/day) |
23.4±9.6 |
20.9±6 |
17.7±7.1* |
0.021 |
|
|
Others(g/day) |
243±94.9 |
263±135 |
216±106.2 |
0.267 |
|
|
Energy(kcal/day) |
1863±587 |
1903±402 |
2203.8±668* |
0.045 |
|
|
FAT percent(%/E) |
38.4±9 |
38.3±8.4 |
35.6±10.1 |
0.414 |
|
|
CHO percent(%/E) |
53.5±9.1 |
50.2±8 |
54.8±16.9 |
0.342 |
|
|
PRO percent(%/E) |
10.9±2.5 |
11±2.1 |
12±2.4* |
0.121 |
|
Table 3. Characteristics of CKD patients based on tertiles of NAE
|
Tertile |
T1 (35.95-51.96) |
T2 (52.4-59.31) |
T3 (59.36-98.16) |
P-value |
|
|
Variable |
|||||
|
Demographic& blood pressure |
Age(yr) |
58.26±19.5 |
55.1±9.7 |
66.43±12.4* |
0.014 |
|
BMI(kg/m2) |
23.3(20.1,29) |
25.2(22.9,28.4) |
26.3(22.4,29.8) |
0.162 |
|
|
Gender(M/F) |
12(18) |
16(14) |
15(15) |
0.567 |
|
|
Diabetes[yes (no)] |
8(22) |
9(21) |
12(18) |
0.539 |
|
|
Hypertension[yes (no)] |
22(8) |
25(5) |
23(7) |
0.645 |
|
|
Biochemical |
Na(mg/dL) |
141(139,142.5) |
142(139.7,143) |
140(139,`43) |
0.358 |
|
P(mg/dL) |
4.4(3.8,4.6) |
4.6(4,5.4) |
4.4(3.5,4.7) |
0.212 |
|
|
K(mg/dL) |
4.1±0.7 |
4.1±0.6 |
4.5±0.7 |
0.075 |
|
|
Ca(mg/dL) |
7.8±1.9 |
8.5±1.5 |
8.6±1.4 |
0.173 |
|
|
Alb(gr/dL) |
3.7±0.5 |
3.5±0.8 |
3.6±0.7 |
0.476 |
|
|
BUN(mg/dL) |
41(28,50.5) |
46(30.5,54) |
32.5(26,43.2)* |
0.048 |
|
|
Cre(mg/dL) |
4.4(3.1,5) |
3.9(2.7,7) |
3.4(1.9,4.5)* |
0.049 |
|
|
GFR(ml/min) |
15.5(11.5,22) |
18.5(12.5,29.2) |
21.1(17.7,37.7)* |
0.025 |
|
|
Dietary intake |
Vegetable(g/day) |
43.5±14.2 |
37.3±11.4 |
30.8±12.6* |
0.oo1 |
|
Dairy food(g/day) |
26.2±8.7 |
20.9±10.1 |
16.7±7.3* |
<0.001 |
|
|
Meat(g/day) |
69.2±22.7 |
58±21 |
49.6±20.4* |
0.003 |
|
|
Fruit(g/day) |
49.7±15.3 |
43.2±13.4 |
35.2±11.3* |
<0.001 |
|
|
Grains(g/day) |
24.2±9 |
20.2±7 |
17.6±6.3* |
0.005 |
|
|
Others(g/day) |
291±120.5 |
246.8±121 |
184±67* |
0.001 |
|
|
Energy(kcal/day) |
1739±447 |
1825±233 |
2406.5±664* |
<0.001 |
|
|
Fat percent(%/E) |
35.6±10 |
39.9±8.5 |
36.9±8.7 |
0.174 |
|
|
CHO percent(%/E) |
49.6±9.2 |
52±6.6 |
56.8±16.9* |
0.077 |
|
|
PRO percent(%/E) |
9.6±2 |
11.5±1.7 |
12.9±2* |
<0.001 |
|
Table 4. Mean Difference (MD) of GFR across of tertiles of PRAL, NEAP and NAE in CKD patients
|
Variable |
Tertile |
T2 |
T3 |
|||||
|
Adjust model |
M.D |
p |
95%CI |
M.D |
p |
95%CI |
||
|
GFR |
NAE
|
crude® |
4.4 |
0.157 |
-10.6,1.7 |
9.7 |
0.002 |
3.5,15.84 |
|
Model I |
4.8 |
0.381 |
-3.97,10.33 |
4.9 |
0.201 |
-2.7,12.5 |
||
|
Model II |
6.2 |
0.086 |
-0.9,6.02 |
7.6 |
0.055 |
-0.03,15.2 |
||
|
PRAL
|
crude |
5.4 |
0.093 |
0.9,11.8 |
5.2 |
0.101 |
-1.1,11.55 |
|
|
Model I |
7.1 |
0.059 |
-14.1,-0.05 |
0.38 |
0.922 |
-7.2,7.96 |
||
|
Model II |
7.92 |
0.022 |
1.2,14.6 |
3.5 |
0.211 |
-11.5,2.5 |
||
|
NEAP |
crude |
5.38 |
0.099 |
-11.7,0.92 |
6.3 |
0.057 |
-0.01,12.6 |
|
|
Model I |
4.3 |
0.843 |
-7.9,6.4 |
5.04 |
0.173 |
-2.24,12.3 |
||
|
Model II |
2.73 |
0.414 |
-3.8,9.28 |
4.45 |
0.195 |
-2.23,11.2 |
||
Analysis based on univariate general linear model(ANCOVA). First Tertile was considered as the reference. M.D:Mean Difference, CI: Confidence Interval, Model I: adjusted for age and daily intake of energy, Model II: additional adjustment for gender, BMI,diabetes and hypertension status.
Table 5. Mean Difference (M.D) of Cre across of Tertiles of PRAL, NEAP and NAE in CKD patients
|
variable |
tertile |
T2 |
T3 |
|||||
|
Adjust model |
M.D |
P |
95%CI |
M.D |
P |
95%CI |
||
|
Cre |
NAE
|
crude |
0.24 |
0.640 |
0.03,2.25 |
-1.14 |
0.041 |
-2.2,0.03 |
|
Model I |
0.1 |
0.871 |
-1.15,1.35 |
0.024 |
0.973 |
-1.3,1.35 |
||
|
Model II |
-0.82 |
0.153 |
-1.95,0.3 |
-0.7 |
0.296 |
-1.9,0.524 |
||
|
PRAL
|
crude |
-0.63 |
0.268 |
-1.7,0.49 |
-1.2 |
0.049 |
-2.3,-0.06 |
|
|
Model I |
-0.92 |
0.134 |
-2.1,0.26 |
-0.2 |
0.785 |
-1.5,1.1 |
||
|
Model II |
-1.33 |
0.019 |
-2.38,0.28 |
-0.8 |
0.194 |
-1.98,0.39 |
||
|
NEAP |
crude |
-1.1 |
0.056 |
0.02,2.05 |
1.69 |
0.003 |
0.6,2.8 |
|
|
Model I |
-0.9 |
0.117 |
-.14,1.24 |
-0.94 |
0.139 |
-2.15,0.27 |
||
|
Model II |
-0.7 |
0.172 |
-1.69,0.29 |
-0.7 |
0.165 |
-1.7,0.285 |
||
Analysis was based on univariate general linear model (ANCOVA). First Tertile was considered as reference Tertile. M.D: Mean Difference, CI: Confidence Interval, Model I: adjusted for age and daily intake of energy, Model II: additional adjustment for gender, BMI, diabetes and hypertension status.
Table 6. Coefficient and p-value of Cubic model of Curve Estimation of Regression for GFR and Cre based on DAL indexes in CKD patients
|
|
PRAL |
NEAP |
NAE |
|||
|
|
B |
p-value |
B |
p-value |
B |
p-value |
|
GFR |
-0.05 |
0.94 |
0.76 |
0.78 |
-1.5 |
0.74 |
|
Cre |
0.35 |
0.47 |
1.2 |
0.65 |
0.93 |
0.27 |
Discussion
The Iranian diet is thought to be relatively acidic due to its high consumption of refined grains such as white rice and non-alcoholic beverages (18). This perception was partially confirmed in this study, because the values of the DAL indices were inclined towards completely positive and acidic values. However, other studies in Iran have showed that unlike to popular belief; the diet of Iranians is prone to alkalinity (14,16,24,25). Also, there was a significant and high association between compenents of DAL indices; thus it can be said that they are similar, not identical components of the acid load equation of the diet.
It should be noted that the PRAL index, despite its significant limitations, unlike the NEAP index, takes into account the amounts of potassium, magnesium and calcium in the diet. These ions can prevent acidic blood (26-28); therefore, PRAL may be more accurate. In Tehran Lipid and Glucose Study (16), the mean PRAL in subgroup CKD patients was -19.46±1.5 mEq/day.This indicates that the diet of Tehranian CKD patients was alkaline. In an American ostudy (29), the mean NEAP in CKD patients was 50.1±13.1 mEq/day. In a Japanese study (30), the median value of PRAL was 6.8 mEq/day and of NEAP was 53.1 mEq/day for CKD patients. African-American CKD patients (15), had median estimated NEAP of 71 mEq/d; and in another study (31), median estimated DAL value, was 47.24 mEq/d. In Venezuelan CKD children study the mean PRAL was 16±10.7 mEq/day. In another study of CKD patients (32) the mean NEAP, PRAL, and NAE were 58.2±24.3, 9.7±18.4, and 32.1±19.8 mEq/day, respectively. Despite most of the studies being conducted among CKD patients, differences in the results of these studies can be attributed to variations in food patterns of population, age groups, designs and number of participants, illness or health of participants, measuring methods and food intake estimating method and variation in confounding factors.
Today, due to the industrialization of the food production process and increased access to food and changing tastes among people, there has been a rise in consumption of refined carbohydrate-based foods, high sodium and protein foods, especially animal proteins; while our ancestors who predominantly consumed plant-based foods and high fiber and potassium (33). This transition has changed very rapidly over the past few decades. In patients with chronic renal failure due to the inability of the renal tubules to excrete toxic acidic metabolic products (15), the metabolic disorders arising from this nutritional transition shift is exacerbated.
In the present study, daily intake of energy and protein percent of energy in the highest category of PRAL were significantly higher compared to the lowest category. Additionally the mean daily energy intake increased significantly across the tertiles of NAE index. Another Iranian study, also showed that high DAL was associated with higher intakes of energy and macronutrients (34). In another Iranian study, energy intake in lower tertiles of PRAL index was higher than higher tertiles; but correlation of energy intke with NEAP index was positive(35). Similar results have been reported in other studies (33). Protein-rich foods can increase the body’s pool of amino acids and ultimately leading to an increase free hydrogen ions in the body, which can decrease the blood pH. It is also important to pay attention to the type of consumed protein.
Animal proteins have high biological availability and are also high in phosphorus. However, an exception in animal sources is milk and dairy products, as their high amount of phosphorus content is neutralized by its high calcium content. In contrast, phosphorus in plant foods is mostly in the phytate form, which has low biological availability, thereby reducing the acidifying effect of phosphorus in plant sources (27,28). In addition, animal proteins have high amount of sulfur-containing amino acids such as methionine and cysteine, which are converted to sulfuric acid in the body. Consequently, animal foods can increase the acidic load of body fluids through this physiological mechanism. Conversely, plant-based protein contains glutamine, which is mostly known as a consumer and recipient of hydrogen ions in the body. Therefore, this is another mechanism by which plant foods positively influence the acid-base balance in the body (36). Furthermore, vegetables are also high in potassium, which binds to organic anions and converts them to bicarbonate, thus slowing down the production of endogenous acid compared to animal foods (37). In countries with nutritional transition, such as Iran, it is estimated that the share of animal protein is more than vegetable protein in diet and with this ratio being twice as high (38). From this perspective, a favorable outlook is not foreseeable.
In this study, the intake of food groups including the cereals and their substitutes, dairy products, fruits, vegetables, meats and their substitutes and miscellaneous food group was significantly lower in the highest category compared to the lowest category of DAL. In an Iranian study, high DAL was associated with lowererintke of fruits, vegetables and dairy foods (34). In another Iranian study, participants with higher values of PRAL and NEAP scores had higher intakes of animal products and higher intakes of fruits and vegetables (35). It is noteworthy that the patients with highest category had a higher BMI than the lowest category, i.e. they were more obese (although none significantly), and given that they also had CKD and had to follow a healthy diet. It is possible that in accordance with the “under reporting Principle” in obese subjects, they may have reported less food intake.
In this study, it was observed that the consumption of fruits, vegetables and dairy products was less than the standard values (each of them were less than one standard unit), and high miscellaneous food consumption as well as daily energy intake on average of about 2,000 kcal, which can be concluded that the nutrient density of the their diet was low and the energy density was high. A low energy density diet, characterized by a high intake of fruits and vegetables, which are rich source of potassium and vitamins such as vitamin C, has been associated with a lower risk of developing CKD. However, it’s important to note that as CKD progresses, the kidneys’ ability to excrete potassium diminishes, necessitating caution when recommending an alkalizing diet high in fruits and vegetables. Also, for individuals on renin-angiotensin system antagonists, regular monitoring of serum potassium levels is advisable. Nevertheless, certain studies have demonstrated that incorporating alkalizing fruits and vegetables into the diet can mitigate acid load and potentially slow CKD progression without significantly raising the risk of hyperkalemia (30).
It can be said that the lower consumption of fruits, vegetables, and dairy products in the higher compared to the lower tertiles of DAL indices is in line with and confirms the results of previous studies. Of course, the lower amount of meat consumption in the higher tertiles of dietary DAL in the present study population, which were patients with chronic kidney failure, may be due to the fear of these patients from consuming meat and proteins, as these patients generally consume less meat and protein than healthy ones. The high consumption of protein and protein in the higher tertiles in other studies may be due to the type of population studied, which are mostly healthy people.
In this study, according one way ANOVA analysis, mean of GFR, was higher and BUN and the Cre were lower significantly in highest category compared to the lowest category of DAL indexes. Furthermore, based on the General Linear Model analysis, the Mean Difference (MD) of GFR was higher in the T3 group compared to the T1 group for all DAL indices, although not all differences were statistically significant. Interestingly, although the association was significant in the ANOVA analysis, it did not maintain significance in the General Linear Model analysis. This suggests that the General Linear Model analysis could attenuate the significance of associations that may be less robust or unreasonable, as observed in the ANOVA analysis.
Modulating the association between DAL and renal function indices, alongside the considered confounding factors, may also stem from the administration of alkalizing drugs tailored to the patients’ specific etiology and stage of CKD. These medications have the potential to alter serum pH levels, thereby influencing the observed correlations (32). In a Isfahan study among diabetic nephropathy patients, a notable and statistically significant correlation was discovered between PRAL and PRO: K indices and levels of BUN and Cre (25). Additionally, various other studies have demonstrated elevating the DAL correlates with lower GFR and a more pronounced decline over time, alongside increased concentrations of Cre (39). A systematic review and meta-analysis of observational (40) and cohort (11,20) studies revealed that higher DAL could significantly increase the risk of CKD. Of course, some other cohort studies (41,42)found no association between DAL and CKD disease. In one interventional study (43), effect of fruits and vegetables or bicarbonate in attenuation of kidney injury was concluded. The mechanisms of underlying the impact of DAL on the development of renal dysfunction can include: First, acidosis caused by the high DAL can increase ammonium ions in kidney tissue without reducing bicarbonate levels, but can lead to toxic effects and damage the tissue of the renal tubules, which in the long term reduces the function of the nephrons. This type of metabolic acidosis can also lead to increased production of the endothelin, which reduces GFR and exacerbates renal tubular tissue damage. The second possible mechanism is the increased production of oxygen free radicals and oxidative stress, which can lead to nephrotoxicity (44-48).
In the present study, it was observed that participants in the highest tertile of DAL had a higher mean age compared to those in the lowest tertile. Given that kidney function tends to decline with in middle and old ages (similar to participants of this study), as individuals get older, kidney function is impaired and the excretion of ammonium compounds from nephrons decreases, it is important for older adults to be mindful of their dietary choices. However, according to the findings of prospective cohort studies conducted in different parts of the world (49,50), the diet of older adults is less likely to produce acid than younger adults, which indicates that this group of population, pay more attention to their diet.
The present study also had its limitations. Its main limitation can be its cross-sectional nature, which impedes the possibility of achieving cause-and-effect association. The dietary intake in this study was assessed using a FFQ, a tool which may be susceptible to both under reporting and over reporting, despite its ease of use and low cost. However, it’s worth noting that the formulas utilized for calculating the PRAL and NEAP indices in this study do not consider the biological availability of nutrients or the sulfur content of various protein sources (51). This limitation should be acknowledged as it may impact the accuracy of the findings. Not taking into account all the confounding factors, including the socio-economic status of participants, could be considered as anothre limitation of the study. Meanwhile control of the confounding factors in statistical analysis of results can be the strength of the study.
Conclusion
Finally, DAL was found to be associated with kidney function in CKD patients only in the crude model, not in adjusted model. Therefore, it can be said that by adjusting the effect of confounding variables, DAL indices of CKD patient did not show significant correlation with renal function. To elucidate the cause-and-effect relationships, long-term study with more and more population and taking into account blood bicarbonate concentration and urinary pH is proposed.
Acknowledgement
This project was reviewed and approved by Ethics Committee of Yasuj University of Medical Sciences (Ethical code: IR.YUMS.REC.1396.29). We offer our special gratitude to the CKD patients who had reffered to Shahid Beheshti Hospital, Yasuj , Iran.
Ethics approval and consent to participate
The protocol of this study was reviewed and approved by the Ethics Committee of Yasuj University of Medical Sciences (Ethical code: IR.YUMS.REC.1396.29). Written informed consent was obtained from all participants. The study adhered to the tenets of the Declaration of Helsinki.
Consent for publication
Not applicable
Availability of data and materials
The datasets generated and/or analysed during the current study are not publicly available due (although it is in the data set , the names of the patients was not been not mentioned, but to address ethical issues)but are available from the corresponding author on reasonable request.
Conflict of Interest
There are no competing interests.
Funding
This research was funded by Yasuj University of Medical Sciences.