Journal of Iranian Medical Council

Journal of Iranian Medical Council

Monitoring Primary Health Care Experience: Validity and Reliability of a Patient-Centered Measure for Services Quality

Document Type : Original article

Authors
1 Department of Health Management and Economics, School of Public Health, Hamadan University of Medical Science, Hamadan, Iran
2 Health Center of Hamadan State, Hamadan University of Medical Science, Hamadan, Iran
3 Asadabad School of Medical Science, Asadabad, Iran
4 Department of Public Health, School of Public Health, Hamadan University of Medical Science, Hamadan, Iran
5 Department of Health Care Management, School of Public Health, Hamadan University of Medical Science, Hamadan, Iran
6 Social Determinants of Health Research Center, Hamadan University of Medical Science, Hamadan, Iran
Abstract
Background: Due to the limited number of valid and reliable tools available to measure the opinions of service recipients regarding the quality of Primary Health Care (PHC), the aim of this study was to develop and validate a patient-centered questionnaire to measure the quality of PHC services.
Methods: The initial questionnaire was designed through literature review, and then, nine Focus Group Discussion (FGDs) sessions with 102 participants were held. To determine the content validity of the questionnaire, two qualitative (experts’ opinions and suggestions) and quantitative (CVR & CVI) methods were used. A total of 26 experts and 650 Service Recipients (SRs) participated in the validation process of the questionnaire. To measure reliability, test-retest methods and internal consistency were utilized.
Results: A total of 46 items in five dimensions were recognized as necessary, relevant and understandable by the experts. Content validity was confirmed by experts. According to the experts, the optimal model was explained in the form of five factors: “patient-centeredness”, “continuity of care”, “quality of facilities and basic amenities”, “access and availability” and “trust”. The fit of the extracted model was confirmed by confirmatory factor analysis at the desired level. The internal consistency of the constructs and all sub-constructs of the questionnaire was favorable (Cronbach’s alpha=0.942 and ICC=0.868). Also, the results of the test-retest in all constructs and all sub-constructs confirmed the reliability of the questionnaire.
Conclusion: In this study, a valid and reliable questionnaire was developed to measure the quality of PHC services from the perspective of service recipients. This measure could be applied for better management of PHC centers and improving the quality of services.

Keywords

Subjects


Abstract 
Background: Due to the limited number of valid and reliable tools available to measure the opinions of service recipients regarding the quality of Primary Health Care (PHC), the aim of this study was to develop and validate a patient-centered questionnaire to measure the quality of PHC services.
Methods: The initial questionnaire was designed through literature review, and then, nine Focus Group Discussion (FGDs) sessions with 102 participants were held. To determine the content validity of the questionnaire, two qualitative (experts’ opinions and suggestions) and quantitative (CVR & CVI) methods were used. A total of 26 experts and 650 Service Recipients (SRs) participated in the validation process of the questionnaire. To measure reliability, test-retest methods and internal consistency were utilized.
Results: A total of 46 items in five dimensions were recognized as necessary, relevant and understandable by the experts. Content validity was confirmed by experts. According to the experts, the optimal model was explained in the form of five factors: “patient-centeredness”, “continuity of care”, “quality of facilities and basic amenities”, “access and availability” and “trust”. The fit of the extracted model was confirmed by confirmatory factor analysis at the desired level. The internal consistency of the constructs and all sub-constructs of the questionnaire was favorable (Cronbach’s alpha=0.942 and ICC=0.868). Also, the results of the test-retest in all constructs and all sub-constructs confirmed the reliability of the questionnaire.
Conclusion: In this study, a valid and reliable questionnaire was developed to measure the quality of PHC services from the perspective of service recipients. This measure could be applied for better management of PHC centers and improving the quality of services.
Keywords: Healthcare quality, Patient centered care, Primary health care, Questionnaire design, Validity and Reliability
 
Introduction
Nowadays, the main strategy of countries to achieve their main goal, which is to improve people’s health, is Primary Health Care (PHC) (1). The reports of the World Health Organization in 2003 and 2008 have discussed the importance of PHC and emphasized its development and improvement in all countries (2,3). 
Papp et al state that to improve the health status of society and to meet people’s health expectations, it is necessary to have a correct understanding of the relationship between the specific characteristics of PHC services and outcomes (4). One of the most important characteristics is the quality of the provided services. Poor quality health care services can lead to higher costs, more illness and disability, less trust in the health system, increased mortality and morbidity, and reduced quality of life (5-8).
The results of a literature review by Endeshaw shows that there are five main models for measuring the quality of healthcare services, namely, Donabedian’s, SERVQUAL, HEALTHQUAL, PubHosQual and HospitalQual: 1. Donabedian is recognized as the first person who studied quality in health care. He proposed the use of a set of three related items, i.e., structure, process, and outcome, to measure the quality of health care services, 2. Another common tool for measuring the quality of health services is the SERVQUAL model. Although there is controversy regarding the validity and reliability of this model, it is commonly used in health care services. To solve the problem of validity and reliability of this model, there should be a new method with psychometric properties that is based on context-based studies and includes functional and technical qualitative aspects of health care organizations, 3. The next model is HEALTHQUAL, which is an adaptation of SERVQUAL. The designers of this model tried to incorporate into the model the practical aspects of service quality that have been confirmed in the literature, 4. The Public Hospital Service Quality Model (PubHosQual) was developed to measure the quality of public hospitals in India from the perspective of the patients. Given that the hospital structure varies from country to country, PubHosQual thus provided a theoretical contribution based on the general context of India. The main problem of this model is that the technical aspects of healthcare services were not included, 5. On the other hand, Itumalla   developed a model called HospitalQual in a public hospital in Hyderabad, India (9). This model was only useful for monitoring, controlling and improving the quality of inpatient services.
Based on the conclusion by author, generic models are no longer sufficient to measure the quality of healthcare services. Developing countries should try to develop their own models to measure the quality of health care services (10).
In general, the quality of health services has two main dimensions: technical quality and service quality. Technical quality is associated with the clinical aspects of the health service, such as the appropriateness of the service provided and the skill of the service provider. Service quality requires that “services meet customer expectations and respond to their needs and requirements” (10). In this study, it is assumed that PHC service recipients have insufficient information about the care process and limited expert knowledge to judge the technical aspects. However, they can evaluate the non-clinical aspects of the service based on their personal experience. Evidence emphasizes that technical aspects of care should not differ between countries and contexts. Therefore, the needs and expectations of service recipients may differ in different countries or health systems (10). Also, there is a major difference between the services provided in PHC and other health sectors, hence it is not surprising that Service Recipients (SRs) expectations and views about the quality of these services be also different. That is why it seems that the examination of quality dimensions from the perspective of PHC service recipients and the design of appropriate measure lead to more accurate results.
There is a lot of research on evaluating the quality of PHC services in the view of SRs which used diferent common tools for evaluating the quality of servicers. In these studies, some limitations of the tools used to evaluate the quality of PHC have been pointed out.
For example, Endalamaw et al have identified the successes and challenges associated with improving the quality of PHC services, but the validity of the framework has not been quantitatively assessed (11). In the research of Ponnet et al, a native tool for measuring the quality of PHC services was designed to evaluate the treatment environments of children in Brazil, but due to the lack of validity and reliability of the tool, there is doubt about its generalization in other parts of the world (12). Also, in the study of Xu et al, the tool designed to assess the quality of PHC in seven provinces of China, only emphasizes patient-related indicators in clinical aspects and does not pay enough attention to other aspects related to PHC (13). A systematic review study by Rahmani et al, examined the researches that evaluated the quality of PHC services based on the SERVQUAL tool. However, one of the main limitations of using this tool for evaluating the quality of PHC is the abstractness of the provided indicators, thus the dimention of this tool cannot examine the details of service quality in PHC (14).
Due to the lack of specific measures for PHC and the difference in the nature of PHC services compared to other health services, one can doubt the validity of the results of these studies (15-21). Considering the lack of valid and reliable tools to reflect the opinions of PHC recipients regarding the quality of services, the present study was conducted with the aim of designing and validating a specific questionnaire to measure the quality of PHC services in the view of SRs (Figure 1).
 
Materials and Methods 
This research is a mixed-method study that first identified various aspects of quality services of PHC through focus group discussions and then evaluated the validity and reliability of the designed questionnaire.
The present study is a part of the project of measuring the quality of PHC services from the perspective of SRs. In this project, focus group discussions were conducted to identify the aspects of PHC quality from the perspective of service recipients (more information is provided in source (22). The present study aimed to develop a standard scale to measure the quality of PHC services, based on the perspective of the SRs and the results of previous phase and examine its validity and reliability.
 
Statistical analysis
In the process of creating the tool, steps were taken in the form of summarizing the qualitative part, checking the content validity and stability of the tool by preliminary study sample (30 items), exploratory factor analysis via SPSS, confirmatory factor analysis in the second sample (650 participants) by the Amos, and the presentation of the final questionnaire and its scoring method.
In the summary of the qualitative part, out of the 132 extracted items, repetitive, irrelevant, and similar items were managed according to the opinion of experts, and finally, 104 items in 13 categories entered the second step. Content validity was done using the Content Validity Index (CVI) and Content Validity Ratio (CVR). In the preliminary study, the internal stability of the instrument (Cronbach’s alpha and sensitivity analysis) and the external stability of the instrument (using the retest method on two rounds with a time interval of 20 days) were conducted. For the statistical classification of the items, exploratory factor analysis was performed in a random sample and 46 items were obtained in 5 components. In order to check and confirm the validity and reliability of the structure and the fit of the created block, confirmatory factor analysis was performed in the second sample of the study.
 
Participants
The participants of Focus Group Discussion (FGDs) were health volunteers. Since primary care recipients do not go to PHCCs continuously, the interval between visits is long and also people of different ages receive different services, it was not possible to sample individuals who recently used various services of centers, hence health volunteers were invited to participate in the study. Iran’s health system has established the healthcare volunteers’ initiative to attract community participation in the PHC. Health volunteers are local residents that cooperate with the PHC system voluntarily. Covered households are divided between health volunteers, and each of them is responsible for monitoring the health issues of their covered households, including follow-up visits, providing basic health education, calling target groups for services, etc. The health volunteers are in touch with people and know their health problems closely. Indeed, health volunteers are the bridge between PHCCs and people. 
Second group of the participants were service providers. This group of participants was selected from public and public-private PHCCs of Hamadan city. The third group was experts from all over the country.  
The inclusion criteria for participants included: having at least one year experience as a health volunteer, service provider or manager in PHC, using the PHCC’ health services during the past year for SRs, having enough information and knowledge in the field of PHC, and willing and able to participate in the study.
At the first phase, through nine FGDs with 70 SRs (5 sections), 16 SPs (2 sections) and 13 experts (2 sections) the views of participants about the quality of PHC services were extracted.
The participants in the content validity stage comprised faculty members with relevant education (health services management, health policy and public health) and PHC experts and officials with at least 5 years of experience in PHC from 5 different provinces of the country.
The participants of the validation phase of the study included 650 service recipients who were selected through the multi-stages sampling. At first, the population was divided into three income groups: high, medium and low. Then, within each cluster, an equal number of health service providers were selected through simple random sampling. Afterwards, Probability of Proportional to Size (PPS) sampling was used to determine the number of participants in each service provider center, according to the volume of the clients. In the service provider centers, systematic random sampling was done based on the “household number”. 
Due to the final tool including 46 items, 15 times the number of questions was considered as the sample population (23). Therefore, 690 questionnaires were distributed. After the initial review of the questionnaires, it was found that 650 of the questionnaires were filled correctly, and this was the basis of the analysis.
After selecting the samples, the questionnaire was completed by interviewing the service recipients at their homes or at service provider centers. People who received no PHC services during the last one year were excluded from the study.
 
Determination and selection of the items
From the 132 items extracted in the qualitative phase of the study (22), after reviewing and analyzing the content of the extracted items, 20 duplicate items and 3 items due to the lack of relevance to the subject of the study were removed. Five items were merged into other items due to their similarity. Finally, 103 items were obtained, which were categorized into 13 dimensions and presented to the experts in the form of a content validity questionnaire presented in the folowing.
 

Table 1. Content validity form for developing the quality of PHC services questionnaire

Score

CVI

CVR

Transparency

Relevance

Simplicity

Necessity

4

Completely transparent

Completely relevant

Completely simple

Necessary

3

Transparent, but need minor changes

Relevant, but need minor changes

Simple, but need minor changes

Useful but not necessary

2

Need some changes

Need some changes

Need some changes

Not necessary

1

Not transparent

Irrelevant

Not simple


Content validity
Content validation refers to a process that aims to ensure that an instrument (checklist, questionnaire, or scale) can correctly assess the content that is expected (24).
In order to determine the content validity of the PHC quality assessment questionnaire, two qualitative (experts’ opinions and suggestions) and quantitative (CVR & CVI) methods were utilized. For qualitative content validity assessment, the compliance with grammar and the appropriate use of words, the appropriate placement of items in the dimensions, and the appropriate scoring of the questionnaire, were checked by eight experts. The submitted comments were carefully reviewed, and necessary corrections were made. 
To check CVI, three criteria of simplicity, relevance and transparency were checked for each item. The CVI score was calculated by dividing the total number of the items which were ranked 3 and 4, by the total number of experts. Items with a score higher than 0.79 were accepted (Table 1).
The CVR (content validity ratio), proposed by Lawshe, is a linear transformation of a proportional level of agreement on how many “experts” within a panel rate an item “essential” calculated in the following way (25): 
 

Reliability
In the present study, to determine the reliability and the stability of responses, the questionnaire and the internal consistency of the items and scales were evaluated. The test-retest method was used to determine the stability of the responses, and Cronbach’s alpha coefficient was calculated to evaluate and determine the internal consistency of the questionnaire. In the first approach, the respondents completed the questionnaire twice with a two-week interval, and the correlation coefficient between the scores was calculated. In the second approach, the internal consistency of the items and scales was evaluated by determining the Cronbach’s alpha coefficient for the entire questionnaire and for each of its scales independently. 
In order to determine the reliability of the questionnaire by Cronbach’s method, 650 service recipients were recruited, and to check the reliability by the before-and-after method, 30 individuals answered the questions again after two weeks.
One of the tests that should be done to check the reliability in clinical environments, which is objective, reliable and valid, is the test-retest (26).

Confirmatory Factor Analysis
Confirmatory Factor Analysis (CFA) is interconnected statistical techniques. When some concepts relation is to be tested, the researcher uses CFA to test a hypothetical model of the system he/she is trying to propose. Thus, CFA helps in identifying the factor structure we believe the phenomena follows or is described by (27).
To evaluate the factor construct, the confirmatory factor analysis model was used. Data were analyzed using IBM statistic SPSS version 23 and IBM SPSS Amos 22.


Table 2. Demographic characteristics of the participants in the primary health service quality question nairetest

Variable

Number (percent)

Mea

(standard deviation)


Test statistics

Gender

Male

73(11.2%)

1.96(0.43%)

t=-1.131

P=0.259

Female

577(88.8%)

2.02(0.40%)

Age (year)

<20

23(3.5%)

1.66(0.47%)

F=16.624


P<0.001

20-30

199(30.6%)

1.87(0.47%)

31-40

286(44%)

2.09(0.33%)

41-50

126(19.4%)

2.10(0.34%)

>50

16(2.5%)

2.20(0.33%)

Education

No degree

232(35.7%)

2.03(0.41%)

F=4.717


P<0.001

High school degree

165(25.4%)

1.90(0.41%)

A.D

169(26%)

2.04(0.33%)

B.S

73(11.2%)

2.10(0.42%)

M.S

11(1.7%)

2.06(0.62%)


Results
Characteristics of the participants
The study was conducted with 650 participants. Most of the participants were female (88.8%) and the education level under diploma (35.7%). Considering that most of the provided PHC services are related to children and locally it has been cultured that this responsibility is on mothers, most of the participants were female. Also, due to the fact that the working hours of the PHC centers are coincide with working hours of men, usually most of the SRs are women.
Most of the participants were from the age group of 31 to 40 years old (44%). In terms of income level, most of the participants (51.4%) had an income of 300 to 600 dollars per month. The relationship between the participants’ gender and their perception of service quality was not significant. On the other hand, the correlation between the participants’ age, education and income with their perception of the quality of PHC services was significant. In this way, with the increase in age, education and income, the quality of services was reported higher (Table 2).


Reliability
In order to check the standard of the designed questionnaire, first the validity and reliability of the extracted questionnaire was evaluated. To check the reliability, through internal consistency Cronbach’s alpha coefficient and test-retest method, Pearson’s coefficient were calculated. The examination of the internal consistency of the questionnaire constructs showed that all the scales and subscales of the questionnaire have the minimum reliability standard (0.7), and according to the Cronbach’s alpha coefficients, the internal consistency of all constructs of the PHC service quality questionnaire is acceptable (Table 3).

Content validity
In order to check the standard of the designed questionnaire, first the validity and reliability of the extracted questionnaire was evaluated. The content validity form was provided to 14 faculty members and 12 experts with executive experience in PHC, and they rated each item.
For qualitative content validity, based on experts’ opinions, 3 components out of 13 components were removed and 5 components were integrated into other components. Through the quantitative content validity assessment, content validity indices were calculated for all the 104 extracted items, as a result of which 48 items were removed due to CVR<0.42 and CVI<0.79. Finally, 46 items in the form of 5 components were obtained.

Normality test
After confirming the standard, the initial questionnaire was distributed to the sample size (n-650). One of the main assumptions of statistical tests is to check the normality of the research variables distribution. Checking the normality of the data has been evaluated through the skewness and kurtosis index in SPSS software. If the skewness and kurtosis are between -2 and +2, the data distribution is normal (Table 4).
Considering that the value of skewness and kurtosis was obtained between -2 and +2, the parametric tests are used in the following.


Table 3. The results of the evaluation of internal consistency (Cronbach’s α) and test-retest of the quality ofprimary health services questionnaire

Quality dimensions

Sample Size

Cronbach’s α

Test-retest (ICC)

Patient-centeredness

30

0.83

0.724

Continuity of care

30

0.778

0.772

Quality of basic amenities

30

0.806

0.861

Access and availabiliry

30

0.751

0.786

Trust

30

0.742

0.854

Total quality

30

0.942

0.868


Table 4. Skewness and kurtosis test results

Research variables

Sample Size

Kurtosis

Skewness

Result

Test type

Patient-centeredness

650

0.652

1.313

Confirm

Parametric

Continuity of care

650

-0.410

1.087

Confirm

Parametric

Quality of basic amenities

650

1.120

0.224

Confirm

Parametric

Access and availability

650

0.325

.500

Confirm

Parametric

Trust

650

0.871

.263

Confirm

Parametric


Table 5. Fit indices of the five-factor model for measuring the quality of primary health services (n=650)

Model

χ2

df

χ2/df

RMSR

RMSEA

(90% CI)

CFI

GFI

AGFI

Total quality

3251.041

972

3.34

0.038

0.060

(0.058;0.062)

0.783

0.777

0.752


Construct validity
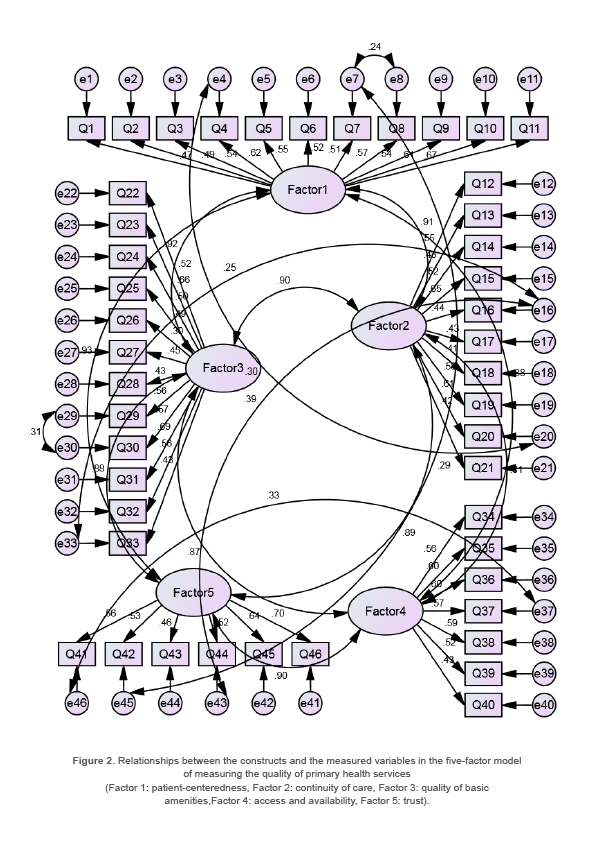
Since in exploratory factor analysis, all the items were classified as one factor, and there was no scientific and logical reason to follow the results of exploratory factor analysis, the items were distributed among different factors based on the opinions of experts, and confirmatory factor analysis was done on the factors determined by the experts. 
The results of the confirmatory factor analysis confirmed the five-factor model, determined by the experts, in terms of the confirmation of the model by the fit indices (Table 5, Figure 2).

Final questionnaire and scoring method
The final scale for evaluating the service quality in PHC was finally extracted and presented in the form of five main dimensions and 46 items (Table 6).


Table 6. Final designed questionnaire

Criteria

Sub-criteria

Patient-centeredness

1. During the service delivery process, do the staffs patiently listen to you and answer all your questions in a friendly manner?

2. During the service delivery process, do the staffs encourage you to express your feelings and concerns about your health problems or needs?

3. Is the presence and participation of other family members, especially men, welcomed in the center?

4. If anyone is willing, are people’s participation in health matters welcomed?

5. Do the staffs of this center ask for your opinion and involve you in making decisions about your own health matters?

6. Are you allowed to choose or reject health services (without pressure and coercion from staffs)?

7. Do the staff talk to you in such a way that other people cannot hear you?

8. If an examination is needed, do the personnel do it out of the other’s sight?

9. Do the personnel respect your beliefs, values and convictions?

10. Have you ever felt that due to things such as gender, lack of money, ethnicity, socio-economic status, etc., proper services were not provided to you?

11. Are special services (such as injections) provided separately by male staff for men and female staff for women?

Continuity of care

12. Are you satisfied with the way of following up the referral result after referral to diagnostic and clinical centers?

13. Will the center follow up if you do not refer to PHC center on time? (Through phone calls, door-to-door visits, or follow-up through health volenteers)

14. Is it possible to provide services permanently by one of the staffs in your usual visits?

15. If one of the staffs is not present, will other personnel provide your required services? Or will the necessary information be provided to you?

16. Are the days when a certain service is not provided informed?

17. If one of the personnel be absent, will the other personnel do his\her tasks?

18. If the center does not provide a certain service at time, will other centers (other than the center in which you registered) provide the service to you?

19. In case of referral to other health centers, is there coordination with the destination center? (introduction letter, phone call, etc.)

20. After you are referred to a specialist or to diagnostic and clinical centers, is there a follow-up to achieve results?

21. If you make a phone call, do the staffs answer your questions properly?

Basic amenities

22. Are the personnel of the center dressed properly and do they consider personal hygiene?

23. Is there enough space and chairs to sit in the waiting room\salon?

24. Is the location of the service departments suitable and is it easy to move between the departments? (No stairs, large distance between departments, lack of physical obstacles in the place of movement between departments, etc.)

25. Is there a separate room for each service provider department?

26. Is the space allocated to each room appropriate?

27. Are there chairs inside the rooms to sit while receiving service and talking to the staffs?

28. Is the environment of the center fun and lively for children and other people?

29. Is the center or department properly cleaned?

30. Is the heating and cooling system of the center suitable in the cold and hot seasons of the year?

31. Is there drinking water for service recepients?

32. Are there clean and suitable washrooms and toilets for service recepients?

33. Are there floor or room guides installed sufficiently in appropriate places?

Access and availability

34. Is there an appointment system (based on day and time) in this center?

35. Is the waiting time, to receive service, appropriate?

36. Is the waiting time, to receive emergency service, appropriate?

37. Has been ever the long distance from your home to the health center led you to refuse to receive a service?

38. Are the working hours of this center proper for you?

39. Do you get services at any time you refer during the working hours of PHC center?

40. Are there health educational references (books, booklets, pamphlets, etc.) available to you when visiting the PHC center?

Trust

41. Do the staffs understand and diagnose your problem well?

42. Do you follow the orders and instructions of the staffs?

43. Have the services provided in this center been effective in solving the problem or responding to your health needs?

44. Do the services provided in this center cover all your health needs?

45. Are you confident about the secrecy of the staffs and the confidentiality of the information you give to the service providers or the contents of your household health file?

46. When providing services and in training classes, do the personnel present the contents in such a way that you can easily deal with some of your problems in the field of the taught topic?


To score the items of the designed questionnaire and obtain an overall picture of service quality, a method invented by a health service quality institute in the Netherlands, was used (28). In this way, the designed questionnaire’ items were scored from the two aspects of importance and performance. The respondents were asked to score the importance of each item and their perception of the quality of care they received in relation to that item (performance). The importance of service quality was scored on a four-point Likert scale from 1 to 10: 0=not important, 3=moderately important, 6=important, and 10=very important.
On the other hand, the perceived performance of the received care was scored on a four-point scale of “never, sometimes, often, and always.”
For analysis, this scale was dichotomized: 0=often/always and 1=never/sometimes.
Finally, the quality of care services for each quality aspect was calculated as follows:
Service quality=10 - (importance x performance).
Then, the service quality score ranged from 0=worst/lowest quality to 10=best/highest quality.
According to experts, a score of less than 5 indicates poor quality, between 5 and 7.5 average, and more than 7.5 demonstrates good service quality.
On the other hand, in most surveys, regardless of the methodology, about 10% of the population reported inadequate quality of care, and a similar percentage were dissatisfied with care in hospitals. Given this result, it is logical that a service quality score of less than 9 represents a significant opportunity for improvement (29).

Discussion
Service quality assessment is a valuable approach to measure the performance of the health system in providing PHC and to identify its strengths and weaknesses and it can provide important information for designing effective strategies for health care management. Therefore, the aim of this study was to develop and validate a patient-centered questionnaire to measure the quality of PHC services.
Based on the results of the study, after measuring the validity and reliability of the primary items, the PHC quality assessment questionnaire was finalized with 46 questions and five conceptual dimentions including “Patient-centeredness”, “Continuity of care”, “Quality of basic amenities”, “Access and availabiliry” and “Trust”. In the study of He et al in China, a questionnaire was designed to measure the quality of PHC services, which has three dimensions: service attitude (patient participation in decision-making, patient-physician relationship and staff behavior), facilities and staff skills (hospital environment, hospital facilities and skill of physicians and nurses) and the patients cost (waiting time, distance to the hospital and cost of services) (30). The subscales and items extracted in the present study cover all the dimensions obtained in the mentioned study. The only difference lies in the cost to patients, which may result from the fact that PHC services in Iran are provided free of charge. 
Also, in the study of Gage et al in Haiti, the quality of PHC services were measured using two scales “service readiness index” (including the five dimensions of essential drugs; diagnostic power; basic equipment; infection prevention; and basic facilities) and “PHC Performance Initiative (PHCPI)” (including the four dimensions of access to services; effective service delivery (trust and belief in the competence of staff); managing and organizing; and patient-centeredness) (31). 
Some dimensions defined for PHC quality in the study of Gage et al (31) including essential drugs, diagnostic power, managing and organizing and infection prevention are not emerged in the present study. Various reasons for this difference can be stated, including the lack of diagnostic services and limited provision of pharmaceutical services in PHC in Iran. Additionally, one of the possible reasons for the absence of the dimension of managing and organizing may be that people perceive the output of managing and organizing in service quality. Also, probably due to the lack of services such as limited surgery, injections, dressings and similar interventions in PHC in Iran, infection prevention has not been the focus of SRs in Iran.
On the other hand, in the current study, one of the dimensions defined for the quality of PHC is continuity of care, which was not considered in the study of Gage et al. One of the possible reasons for this issue can be the lack of integration of PHC and higher levels of service provision and the absence of mandatory referral system in Iran.
In the study of Kaitelidou et al in Greece, the dimensions of the quality of PHC services included access, technical quality of services, interpersonal aspects (comprising trust in the ability of personnel and patient-centered), continuity of cares and physical environment (including the space for providing services such as the cleanliness, the convenience of service recipients, room signs, etc.) (32). As it can be comprehended, all the dimensions identified in the study of Kaitelidou et al are covered in the present study. The similarity between the quality dimensions of PHC services in different countries and populations indicates that the designed questionnaire in this study can be a basis for conducting similar studies in other countries.
On the other hand, in different countries with different health systems, PHC is provided with different structures and methods, which can affect the definition and the dimensions of the quality of PHC services. In the systematic review study by Dorri Kafrani et al which investigated the patterns of measuring and improving quality in PHC worldwide, 8 different models for evaluating and improving the quality of PHC have been presented, each of which can be used individually or in combination for different contexts according to the limitations and facilities (33). Therefore, in the present study, it has been tried to develop and validate a questionnaire based on the specific conditions and characteristics of PHC in Iran, in order to provide the possibility of identifying and solving challenges related to quality of services.
With the aim of finding a suitable tool for measuring the quality of healthcare services that is in accordance with the unique nature of the health system in different countries, Endeshaw examined and compared different models of health service quality assessment from different dimensions in the form of a literature review study (10). The author of the study finally concluded that the existing western frameworks and tools are incompatible with the health context of developing countries due to cultural and economic differences. In the literature review, it was confirmed that each country and even each healthcare service organization should have its own framework for measuring the quality of healthcare services. In addition, a continuous effort should be made to redefine quality criteria and study the complex issues of service quality in the health care setting.
In this study, the face, content and construct validity of the designed questionnaire were evaluated. Based on the results of qualitative and quantitative face validity, in the view of the participant, all the items of the questionnaire had good fit and connection with its main purpose and were understandable. Also, the qualitative and quantitative content validity confirmed the necessity of the 46 items and the simplicity, relevance and clarity of each of them according to the experts. The results of confirmatory factor analysis also confirmed the extracted model.
In the present study, the reliability assessment of the PHC service quality questionnaire showed that all the scales and subscales of the questionnaire have good internal consistency. Also, the reliability of the questionnaire was assessed using the test-retest method on 30 participants at a two-week interval. Examining the reliability of the questionnaire using the test-retest method is one of the advantages of the present study compared to other studies that only use Cronbach’s alpha method (30,32,34-36).
The results of study revealed that there is no difference between women and men in terms of people’s perception of the quality of PHC services. This result can indicate gender justice in providing services to the society. The study by Rezaei et al (37) which was conducted in Iran with the aim of comparing the services quality in urban and rural PHC centers and the study by Chung et al (38) in China and Dullie et al (35) study in Mali also obtained the same result. The results of these studies suggested that there is no significant difference between the gender of people and their perception of service quality. The findings of the present study are in contrast with the findings of the study of Bustamante et al, who showed that women’s perception of the quality of PHC services is different from men (39).
On the other hand, income, the level of education and age of individuals affect their perception of the quality of PHC services. In the studies conducted in Iran and other countries, there was no significant relationship between people’s age and level of education with their perception of the quality of PHC services (34,36,37). The reason for this difference can be the use of different measures or can be the different structures of providing PHC services. To find out the reason for this result, it is necessary to conduct more studies using developed questionnaire in different populations. 

Study limitations
One of the limitations of the study is testing the developed questionnaire on the urban community in one province, which can make it difficult to generalize the results to rural communities and other provinces. Also, since the questionnaire designed in this study is a self-report measure, the answers may be affected by response bias. It is suggested that in future studies to more test the questionnaire, surveys should be conducted among different populations in order to obtain more reliable results.

Conclusion
In this study, a valid and reliable questionnaire was developed to measure the quality of PHC services from the perspective of service recipients. This tool can be useful in examining the difference between PHC centers and different populations, and provide the basis for improving the management and the quality of PHC services, thus helping to improve the individual and public health. Also, this measure can be used as a practical guide for future studies in order to investigate the possible relationships between independent variables (for instance, demographic variables) or the impact of service quality on health outcomes such as service utilization, service effectiveness, etc.

Acknowledgement
Initially, the authors would like to thank the participants in the study, who expressed their view about the quality of PHC services. They would also like to thank the officials of district health center of Hamadan city and the UPHCC staffs who helped in FGDs and other steps of the study.
This study was approved by the Ethics Committee of authors’ institute (ethical number: IR.UMSHA.REC.1395.453).

Conflict of Interest
There was no conflict of interest in this manuscript.

  1. Starfield B, Shi L, Macinko J. Contribution of primary care to health systems and health. Milbank Q 2005;83(3):457-502. https://pubmed.ncbi.nlm.nih.gov/16202000/
  2. World Health Organization. The world health report 2003: shaping the future: World Health Organization.
  3. World Health Organization. WHO report on the global tobacco epidemic, 2008: the MPOWER package. World Health Organization; 2008 Feb 11.
  4. Papp R, Borbas I, Dobos E, Bredehorst M, Jaruseviciene L, Vehko T, et al. Perceptions of quality in primary health care: perspectives of patients and professionals based on focus group discussions. BMC Fam Pract 2014 Jun 28;15:128. https://pubmed.ncbi.nlm.nih.gov/24974196/
  5. Brook RH, McGlynn EA, Shekelle PG. Defining and measuring quality of care: a perspective from US researchers. Int J Qual Health Care 2000 Aug;12(4):281-95. https://pubmed.ncbi.nlm.nih.gov/10985266/
  6. DuPlessis HM, Inkelas M, Halfon N. Assessing the performance of community systems for children. Health Serv Res 1998 Oct;33(4 Pt 2):1111-42. https://pubmed.ncbi.nlm.nih.gov/9776951/
  7. Koenig MA, Foo GH, Joshi K. Quality of care within the Indian family welfare programme: a review of recent evidence. Stud Fam Plan 2000 Mar;31(1):1-18. https://pubmed.ncbi.nlm.nih.gov/10765534/
  8. Sharifirad GR, Shamsi M, Pirzadeh A, Farzanegan PD. Quality gap in primary health care services in Isfahan: women’s perspective. J Educ Health Promot 2012;1:45. https://pubmed.ncbi.nlm.nih.gov/23555148/
  9. Itumalla R, Acharyulu G, Shekhar B. R. Development of hospitalqual: a service quality scale for measuring in-patient services in hospital. Operations and Supply Chain Management: An International Journal 2014;7(2):54-63.
  10. Endeshaw B. Healthcare service quality-measurement models: a review. J Health Res 2021 Mar 1;35(2):106-17. https://doi.org/10.1108/JHR-07-2019-0152
  11. Endalamaw A, Khatri RB, Erku D, Nigatu F, Zewdie A, Wolka E, et al. Successes and challenges towards improving quality of primary health care services: a scoping review. BMC Health Serv Res 2023 Aug 23;23(1):893. https://pubmed.ncbi.nlm.nih.gov/37612652/
  12. Ponnet L, Willems S, Vyncke V, Bousquat AEM, Viana ALD, Mello GA, et al. Evaluation of the quality of primary health care services for children: reflections on the feasibility of using the Brazilian version of the Primary Care Assessment Tool as a routine assessment tool. Einstein (Sao Paulo) 2019 Feb 7;17(1):eAO4333. https://pubmed.ncbi.nlm.nih.gov/30758398/
  13. Xu DR, Hu M, He W, Liao J, Cai Y, Sylvia S, et al. Assessing the quality of primary healthcare in seven Chinese provinces with unannounced standardised patients: protocol of a cross-sectional survey. BMJ Open 2019 Feb 1;9(2):e023997. https://pubmed.ncbi.nlm.nih.gov/30765399/
  14. Rahmani H, Maleki R, Ghanbari MK, Behzadifar M. Quality assessment of services in primary healthcare in Iran: a systematic review and meta-analysis. Ethiop J Health Sci 2022 Mar;32(2):453-62. https://pubmed.ncbi.nlm.nih.gov/35693585/
  15. Adepoju OO, Opafunso Z, Ajayi M. Primary health care in south west Nigeria: evaluating service quality and patients’ satisfaction. African J Sci Technol Innovat Dev 2018 Jan 1;10(1):13-19. DOI:10.1080/20421338.2017.1380585
  16. Esmaeili Shahmirzadi S, Shojaeizadeh D, Moradian Sorkhklaei M, Lashgarara B, Tarahi MJ, Taheri G. [Comparing the quality of the provided services in public health sites with collaborative health sites.] J Health Syst Res 2013 Feb 10;8(7):1225-34. Persian. URL: http://hsr.mui.ac.ir/article-1-490-en.html
  17. Mohammadi A, Shoghli A. [Survey on quality of primary health cares in Zanjan District Health Centers.] J Adv Med Biomed Res 2008 Dec 10;16(65):89-100. Persian. URL: http://journal.zums.ac.ir/article-1-881-en.html
  18. Nnebue CC, Ebenebe UE, Adinma ED, Iyoke CA, Obionu CN, Ilika AL. Clients’ knowledge, perception and satisfaction with quality of maternal health care services at the primary health care level in Nnewi, Nigeria. Niger J Clin Pract 2014 Sep-Oct;17(5):594-601. https://pubmed.ncbi.nlm.nih.gov/25244270/
  19. Safi MH, Fereydounfar AA, Arshi S. [Quality of primary health Services in the Clinics of Shomal health Center of Tehran.] Common Health 2014;1(1):54-61. Persian. Available at: https://sid.ir/paper/253874/en
  20. Simão CCAL, Costa MB, Colugnati FAB, de Paula EA, Vanelli CP, de Paula RB. Quality of care of patients with diabetes in primary health services in southeast brazil. J Environ Public Health 2017;2017:1709807. https://pubmed.ncbi.nlm.nih.gov/29129980/
  21. Valius L, Rastenytė D, Malinauskienė V, Krančiukaitė-Butylkinienė D. Evaluation of the quality of services in primary health care institutions. Medicina (Kaunas) 2011;47(1):57-62. https://pubmed.ncbi.nlm.nih.gov/21681013/
  22. Gharaee H, Jahanian R, Azami-Aghdash S, Bande-Ehahi K, Saati MH, Hamidi Y, et al. Service recipients and providers’ perception about the service quality and improving solutions in primary health care: a qualitative study. 2024.
  23. Gunawan J, Marzilli C, Aungsuroch Y. Establishing appropriate sample size for developing and validating a questionnaire in nursing research. Belitung Nurs J 2021 Oct 28;7(5):356-60. https://pubmed.ncbi.nlm.nih.gov/37496511/
  24. Alqahtani TM, Yusop FD, Halili SH. Content validity of the constructivist learning in higher education settings (CLHES) scale in the context of the flipped classroom in higher education. Humanit Soc Sci Commun 2023;10(1):268. https://pubmed.ncbi.nlm.nih.gov/37273418/
  25. Ayre C, Scally AJ. Critical values for Lawshe’s content validity ratio: revisiting the original methods of calculation. Measure Evaluat Counsel Dev 2014 Jan;47(1):79-86. https://doi.org/10.1177/0748175613513808
  26. Gierlich J, Barsties V Latoszek B. Test-retest reliability of the acoustic voice quality index and the acoustic breathiness index. J Voice 2023 Aug 16:S0892-1997(23)00223-0. https://pubmed.ncbi.nlm.nih.gov/37596099/
  27. Sarmento RP, Costa V. Confirmatory factor analysis--a case study. arXiv preprint arXiv:1905.05598. 2019 May 8. DOI: https://doi.org/10.48550/arXiv.1905.05598
  28. van der Eijk I, Sixma H, Smeets T, Veloso FT, Odes S, Montague S, et al. European collaborative study group on IBD. quality of health care in inflammatory bowel disease: development of a reliable questionnaire (QUOTE-IBD) and first results. Am J Gastroenterol 2001 Dec;96(12):3329-36. https://pubmed.ncbi.nlm.nih.gov/11774945/
  29. Tabrizi JS, O’Rourke PK, Wilson AJ, Coyne ET. Service quality for Type 2 diabetes in Australia: the patient perspective. Diabet Med 2008 May;25(5):612-7. https://pubmed.ncbi.nlm.nih.gov/18445176/
  30. He X, Li L, Bian Y. Satisfaction survey among primary health care outpatients in the backward region: an empirical study from rural Western China. Patient Prefer Adherence 2018 Oct 2;12:1989-96. https://pubmed.ncbi.nlm.nih.gov/30323568/
  31. Gage AD, Leslie HH, Bitton A, Jerome JG, Joseph JP, Thermidor R, et al. Does quality influence utilization of primary health care? Evidence from haiti. Glob Health 2018 Jun 20;14(1):59. https://pubmed.ncbi.nlm.nih.gov/29925416/
  32. Kaitelidou D, Economou C, Galanis P, Konstantakopoulou O, Siskou O, Domente S, et al. Development and validation of measurement tools for user experience evaluation surveys in the public primary healthcare facilities in Greece: a mixed methods study. BMC Fam Pract 2019 Apr 2;20(1):49. https://pubmed.ncbi.nlm.nih.gov/30940098/
  33. Dorri Kafrani S, Zolfagharnasab A, Torabi F. [Primary health care quality improvement patterns: a systematic review study.] J School Public Health Institut Public Health Res 2019 Sep 10;17(2):169-82. Persian. URL: http://sjsph.tums.ac.ir/article-1-5765-en.html
  34. Aoki T, Fukuhara S, Yamamoto Y. Development and validation of a concise scale for assessing patient experience of primary care for adults in Japan. Fam Pract 2020 Feb 19;37(1):137-42. https://pubmed.ncbi.nlm.nih.gov/31325300/
  35. Dullie L, Meland E, Hetlevik Ø, Mildestvedt T, Gjesdal S. Development and validation of a Malawian version of the primary care assessment tool. BMC Fam Pract 2018 Dec;19:1-1. https://pubmed.ncbi.nlm.nih.gov/29769022/
  36. Hosseinpoor M, Yazdi Feyzabadi V, Balali Meybodi F, Hajimaghsoudi S. [Customers’ satisfaction with primary health care: comparison of two district health centers with and without ISO certificate in Kerman University of Medical Sciences.] Health Dev J 2013 May 1;2(1):54-64. Persian. Available at: https://jhad.kmu.ac.ir/article_91397.html
  37. Rezaei B, Rezaeian M. [Satisfaction rate regarding services provided in health-care centers and its effective factors in Rafsanjan, 2017: A Descriptive Study.] JRUMS 2019 Aug 10;18(6):573-86. Persian. URL: http://journal.rums.ac.ir/article-1-4381-en.html
  38. Chung VCh, Yip BH, Griffiths SM, Yu EL, Liu S, Ho RS, et al. Patients’ experience of Chinese Medicine Primary Care Services: Implications on Improving Coordination and Continuity of Care. Sci Rep 2015 Dec 21;5:18853. https://pubmed.ncbi.nlm.nih.gov/26686267/
  39. Bustamante U MA, Tello M, Carvache-Franco M, Carvache-Franco O, Carvache-Franco W. Statistical determination of service quality gaps in primary health care in Guayas, Ecuador. PLoS One 2024 Mar 15;19(3):e0299994. https://pubmed.ncbi.nlm.nih.gov/38489322/

------WebKitFormBounda^ryuTq6kilIdufU5RNq Content-Disposition: form-data; name="dor"

Volume 8, Issue 2 - Serial Number 28
Spring 2025
Pages 226-239

Figure 1. Process of designing and validating the quality of primary health services questionnaire.
Figure 2. Relationships between the constructs and the measured variables in the five-factor model of measuring the quality of primary health services (Factor 1: patient-centeredness, Factor 2: continuity of care, Factor 3: quality of basic amenities,Factor 4: access and availability, Factor 5: trust).