Document Type : Original article
Abstract
Background: There is an association between Cardiometabolic Parameters (CPs) and liver fibrosis in Non-Alcoholic Fatty Liver Disease (NAFLD). This study investigated the relationship between CPs with liver fibrosis and steatosis in NAFLD.
Methods: Fatty liver severity, fibrosis, and steatosis were determined by elastography in patients with NAFLD. CPs, including the Atherogenic Index of Plasma (AIP), Lipid Accumulation Product (LAP), Cardiometabolic Index (CMI), and Lipoprotein Combination Index (LCI), were calculated.
Results: 170 subjects with NAFLD were included. No associations between CMI (p=0.456), AIP (p=0.44), LCI (p=0.822), and LAP (p=0.599) with fibrosis were found. Also, no associations were found between CMI (p=0.429), AIP (p=0.398), LCI (p=0.095), and LAP (p=0.788) with steatosis. The 0.52 cutoff of AIP index has 0.6 area under curve (AUC) for F3 and F4 diagnosis (95%CI:0.574-0.722) (p=0.010). 2.16 cutoff of CMI has 0.6 AUC for F3 and F4 diagnosis (95%CI: 0.56-0.709) (p=0.02). The CMI (p=0.023), AIP (p=0.011), and LAP (p=0.035) were significantly higher in men. Multivariant analysis revealed that patients with waist circumference (W.C)≥90 (OR=3.07, 95%CI (1.38, 6.83) (p=0.006), waist-to-hip Ratio (WHR)>0.88 in males and >0.83 in females OR=3.96, 95% CI (1.48, 10.61) (p=0.006), waist-to-height ratio (WHtR)>0.5 OR=2.79, 95%CI (1.08, 7.21)(p=0.034) have higher odds for fibrosis development.
Conclusion: Our data demonstrated there is no association between CPs with steatosis and fibrosis. CMI and AIP have favorable predictive value in high-grade fibrosis. Our data also revealed that W.C≥90, WHR>0.88 or 0.83, and WHtR>0.5 are associated with fibrosis.
Keywords: Cardiometabolic indicators, Fibrosis, Non-alcoholic fatty liver, Steatosis
Introduction
Increasing non-contagious and chronic disorders such as Non-Alcoholic Fatty Liver Disease (NAFLD) cause the proliferation of studies to prevent and identify susceptible subjects for NAFLD development. It was estimated that 25% of the general population suffers from NAFLD. NAFLD is highly associated with obesity, metabolic disorders, type II diabetes mellitus, and Cardiovascular Disorders (CVD) (1). Based on a recent report, 13.11% of the general population and 14.55% of Asians suffer from a subtype of NAFLD called lean NAFLD (2). In this regard, the influence of Cardiometabolic (CPs) and Anthropometric parameters (Aps) on NAFLD development took the attention of researchers
Dyslipidemia is widespread in patients with NAFLD, thus untreated NAFLD can lead to CVD and increase its risk (3-5). Cardiometabolic Index (CMI) is a novel predictor of obesity and hyperlipidemia associated with diabetes and cardiovascular disease (6,7). A Chinese study reported that CMI has a predictive value (PV) for NAFLD in patients with type 2 diabetes (8). The Atherogenic Index of Plasma (AIP) is a new quantitative index used to assess lipid levels and is a strong indicator of dyslipidemia (9,10). AIP is calculated through the logarithmic ratio between triglyceride and HDL-C levels, which indicates the association between atherogenic and protective lipoprotein (11). High levels of AIP are associated with metabolic syndrome (12). Lipid Accumulation Product (LAP) is an index to estimate excess fat accumulation, calculated by waist circumference and triglycerides, and shows lipotoxicity. Following dyslipidemia, total cholesterol and triglycerides increase, and the Lipoprotein Combination Index (LCI) also increases (13).
It is estimated that in 2030, the most important cause of death from liver diseases will be non-alcoholic fatty liver disease (14). This research examines the relationship between CPs, including CMI, AIP, ALP, and LCI, and liver fibrosis and steatosis severity in non-diabetic patients with NAFLD.
Materials and Methods
Study Population
The present cross-sectional study examined 170 non-diabetic patients with NAFLD referred to Imam Khomeini Hospital in Ahvaz, 2021.
The inclusion criteria were age 18-65 years, fatty liver diagnosed by ultrasound, and definitive steatosis and fibrosis diagnosis by fibro touch elastography (FT100 model).
Exclusion criteria were diabetes, chronic kidney disease, viral hepatitis, autoimmune hepatitis, drug-induced hepatitis, alcoholic hepatitis, alcohol consumption in any amount, using methotrexate, corticosteroid, tamoxifen, and amiodarone drugs. All the demographic information of the patients was recorded. Written consent to participate was obtained before the inclusion.
Liver stiffness and steatosis
Fatty liver, steatosis severity, and fibrosis measurements were carried out by Vibration-Controlled Transient Elastography (VCTE). Fibroscan was measured by an experienced technician blinded to the patient’s clinical information. The data was monitored and confirmed by a hepatologist. Measurements were performed using a standard 3.5 MHz probe on the right hepatic lobe through the intercostal spaces while the patient was supine. Measures were considered valid after the following criteria were met: (1) there were at least 10 valid shots, (2) the success rate was at least 60%, and (3) the interquartile range was less than 30% of the mean values. Steatosis was assessed visually based on the percentage of liver cells containing fat (%).
Liver fibrosis and steatosis were classified as follows:
F0: LSM (Liver Stiffness Measurement): <6 KP
F1: LSM: 6–8.1 KP
F2: LSM: 8.2–9.6 KP
F3: LSM: 9.7–13.5 KP
F4: LSM: ≥13.6 KP
S1: CAP (Controlled Attenuation Parameter): 238-260 db/m (11-33%)
S2: CAP: 260-292 db/m (34-66%)
S3: CAP ≥292 db/m (>67%)
Cardiometabolic Parameters Measurement
A digital body composition monitor scale made in Japan (0.1 kg accuracy) was used without shoes and with as little clothing as possible to evaluate the weight. A tape measure (0.5 cm accuracy) was utilized to measure height.
The following cardiometabolic scales were calculated:
AIP: Log (TG/HDL-C)
LAP: (Waist Circumference [WC]-65) *TG for men and (WC-58) *TG for women
CMI: TG/HDL*WHtR
LCI: TG*Total cholesterol*LDL/HDL
Anthropometric Parameters Measurement
APs, including WC, Waist-to-Hip Ratio (WHR), and Waist-to-Height Ratio (WHtR), were calculated based on the reference (15). WC (cm) was assessed at the end of expiration, with a Gulick II spring-loaded measuring tape (Gay Mills, WI) midway between the inferior angle of the ribs and the supra iliac crest just below the level of the umbilicus (16,17). The WHR was calculated by dividing the WC (cm) by the hip circumference (cm) (16). The WHtR is calculated by dividing the WC by height (18). Body Mass Index (BMI) was calculated using the weight formula in kg/m2.
Clinical and Laboratory Measurements
Fasting blood sugar and lipid profile were measured. After 20 minutes of resting on a comfortable seat, the blood pressure was measured twice by a fully automated Blood Pressure (BP) monitor (Omron automated blood pressure monitor, HEM, 71217, Japan). The average of two BP was recorded as final BP.
Statistical analysis
Smirnov–Kolmogorov test was used to check the normality of the data. Continuous variables were presented as mean±Standard Deviation (SD) and compared by one-way analysis of variance (ANOVA). Also, the categorical variables were presented as frequency and percentage, and compared by Chi-square test.
Both univariate and multivariate logistic regression models were applied to calculate Odds Ratios (ORs) and 95% confidence interval for occurrence of fibrosis and steatosis in patients with NAFLD.
To investigate the diagnostic accuracy of data, receiver operating characteristic curve (ROC curve) and sensitivity and specificity indices were utilized to evaluate diagnostic accuracy. A p-value less than 0.05 was considered significant. Data were analyzed using SPSS software (V26).
Table 1. The demographic information of the patients
|
Variables |
Results |
|
Gender Female, n(%) Male, n(%) |
69(40.6) 101(59.4) |
|
Age (year), mean±SD |
42.89±12.25 |
|
Age, year, n(%) <41 ≥41 |
82(48.2) 88(51.8) |
|
BMI, n(%) <30 ≥30 |
107(62.9) 63(37.1) |
BMI-Body Mass Index
Results
170 subjects with NAFLD with a mean age of 42.89±12.25 years were included. 59.4% (101) of the patients were males and 40.6% (69) were female. Based on age, the patients were classified into two groups: <41 years (51.8%) and ≥41 years (48.2%) (Table 1). 62.9% (107) of the participants had a BMI<30 (Table 1).
The mean of CMI (p-value=0.023), AIP (p-value=0.011), and LAP (p-value=0.035) were significantly higher in men (Table 2), while no significant difference was observed for LCI (p-value=0.115). CMI (p-value=0.833), AIP (p-value=0.309), LCI (p-value=0.539), and LAP (p-value=0.783) were not different between patients with<41 and ≥41 years (Table 2).
The association between fibrosis severity and CPs
Patients were classified into four groups based on the fibrosis grade. CMI (p-value=0.456), AIP (p-value =0.44), LCI (p-value=0.822), and LAP (p-value =0.599) were not different between fibrosis grades (Table 4). Multivariate analysis demonstrated that there was no association between fibrosis grade and CMI (p-value=0.63), AIP (p-value=0.548), LCI (p-value=0.976), and LAP (p-value=0.893) (Table-3).
Patients were divided into two groups, fibrosis, and non-fibrosis, and then univariate and multivariate analyses were done. The results revealed that there was no significant relationship between fibrosis and CMI (p-value=0.876), AIP (p-value=0.764), LCI (p-value=0.705), and LAP (p-value=0.132) (Table 4).
Table 2. The relationship between gender and age with CPs
|
p-value |
Age (years) |
P-value |
Gender |
Parameters |
||
|
≥41 |
<41 |
Female |
Male |
|||
|
0.883 |
2.44±1.36 |
0.023 |
2.07±0.93 |
2.76±1.97 |
CMI, mean±SD |
|
|
0.309 |
0.5±0.21 |
0.011 |
0.5±0.21 |
0.62±0.31 |
AIP, mean±SD |
|
|
0.539 |
64011.4±67321.9 |
0.115 |
52723±39921.16 |
73780±777117.8 |
LCI, mean±SD |
|
|
0.783 |
5424.6±2697.57 |
0.035 |
5424.6±2697.57 |
6900.9±4203.9 |
LAP, mean±SD |
|
AIP: Atherogenic Index of Plasma; LAP: Lipid Accumulation Product; CMI: Cardiometabolic Index; LCI: Lipoprotein Combine Index
Table 3. Univariate and multivariate analysis between CPs and fibrosis severity
|
Univariable |
Multivariant |
||||||||
|
Parameters |
F1 |
F2 |
F3 |
F4 |
OR (95% CI) |
P-value |
OR (95% CI) |
p-value |
|
|
CMI |
Mean±SD |
2.48±1.28 |
2.75±2.84 |
2.51±1.33 |
1.83±0.76 |
(0.78,1.12) 0.93 |
0.456 |
(0.79,15.1) 0.96 |
0.634
|
|
Median(IQR) |
2.21(1.59) |
2.27(1.7) |
2.44(1.85) |
1.85(1.36) |
|||||
|
AIP |
Mean±SD |
0.58±0.24 |
0.57±0.24 |
0.62±0.48 |
0.45±0.18 |
(0.72,1.15) 0.91 |
0.44 |
(0.70,1.21) 0.92 |
0.548
|
|
Median(IQR) |
0.59(0.28) |
0.56(0.29) |
0.59(0.35) |
0.47(0.28) |
|||||
|
LCI |
Mean±SD |
63428 ±49457 |
65339 ±723404 |
69125 ±99636 |
52236 ±52713 |
(0.96,1.05) 1.01 |
0.822 |
(0.95,1.05) 0.99 |
0.976
|
|
Median(IQR) |
42830 (62335) |
40323 (67370) |
35168 (52829) |
31845 (38402) |
|||||
|
LAP |
Mean±SD |
6449.7±3581 |
7089±4589 |
7319±3585 |
4819±2975 |
(0.9,1.06) 0.96 |
0.599 |
(0.91,1.08) 0.99 |
0.893 |
|
Median(IQR) |
6068(4200) |
5804(4987) |
6332.5 (3587) |
4459(5698) |
|||||
AIP: Atherogenic Index of Plasma; LAP: Lipid Accumulation Product; CMI: Cardiometabolic Index; LCI: Lipoprotein Combine Index
Table 4. Univariate and multivariate analysis of the association between CPs and fibrosis (two modes)
|
Univariable |
Multivariable |
||||||
|
Parameters |
No |
Yes |
OR (95% CI) |
P-value |
OR (95% CI) |
p-value |
|
|
CMI |
Mean±SD |
54.1±2.56 |
45.2±1.71 |
(0.79,1.17)0.96 |
0.693 |
0.98(0.8, 1.21)
|
0.876 |
|
Median(IQR) |
2.2(2.1) |
2.17(1.42) |
|||||
|
AIP |
Mean±SD |
0.59±0.24 |
0.56±0.29 |
(0.73,1.17)0.93 |
0.517 |
0.96(0.73,1.26) |
0.764 |
|
Median(IQR) |
0.57(0.36) |
0.56(0.27) |
|||||
|
LCI |
Mean±SD |
68191±63485 |
633329±66669 |
(0.93,1.05)0.99 |
0.668 |
0.99(0.93,1.05) |
0.705 |
|
Median(IQR) |
43140(63966) |
38910(54350) |
|||||
|
LAP |
Mean±SD |
5728.9±3521.8 |
6520.7±3875.6 |
(0.96,1.18)1.07 |
0.220 |
1.09(0.97,1.21) |
0.132 |
|
Median(IQR) |
5017(4103) |
5779.5(4487) |
|||||
AIP: Atherogenic Index of Plasma; LAP: Lipid Accumulation Product; CMI: Cardiometabolic Index; LCI: Lipoprotein Combine Index
The association between steatosis severity and CPs
Patients were divided into three subgroups based on the severity of the steatosis. The results showed that there is no significant relationship between the steatosis severity and CMI (p-value=0.429), AIP (p-value=0.398), LCI (p-value=0.095), and LAP (p-value=0.788) (Table 5). Multivariant analysis revealed that there was no significant relationship between steatosis and CMI (p-value=0.192), AIP (p-value=0.678), LCI (p-value=0.068), and LAP (p-value=0.905) (Table 6).
Patients were divided into two groups (with steatosis and without steatosis) to investigate the possible relationship between CPs and steatosis. The results showed that there is no significant relationship between steatosis with CMI (p-value=0.111), AIP (p-value=0.452), LCI (p-value=0.254), and LAP (p-value=0.439) (Table 5).
Table 5. Univariate and multivariate analysis of the association between CPs and steatosis (two modes)
|
Univariable |
Multivariable |
||||||
|
Parameters |
No |
Yes |
OR (95%CI) |
P-value |
OR (95%CI) |
p-value |
|
|
CMI |
Mean±SD |
2.85±1.85 |
2.31±1.06 |
0.99(0.72,1.14) |
0.382 |
0.78(0.6,1.05) |
0.111 |
|
Median(IQR) |
2.16(1.75) |
2.21(1.17) |
|||||
|
AIP |
Mean±SD |
0.57±0.25 |
0.59±0.35 |
1.06(0.84,1.34) |
0.617 |
0.9(0.68,1.18) |
0.452 |
|
Median(IQR) |
0.56(0.31) |
0.59(0.25) |
|||||
|
LCI |
Mean±SD |
66882±73973 |
59103±38222 |
0.98(0.92,1.04) |
0.486 |
0.96(0.91,1.02)
|
0.254 |
|
Median(IQR) |
36789(25038) |
47320(60638) |
|||||
|
LAP |
Mean±SD |
6311.6±4037.1 |
6294±2836 |
0.999(0.91,1.09) |
0.978 |
0.96(0.87,1.06)
|
0.439 |
|
Median(IQR) |
5628(4881) |
5985(4072) |
|||||
AIP: Atherogenic Index of Plasma; LAP: Lipid Accumulation Product; CMI: Cardiometabolic Index; LCI: Lipoprotein Combine Index
Table 6. Univariate and multivariate analysis of the association between CPs and steatosis severity
|
Univariable |
Multivariant |
|||||||
|
Parameters |
S1 |
S2 |
S3 |
OR (95% CI) |
P-value |
OR (95% CI) |
p-value |
|
|
CMI |
Mean±SD |
59.2±1.15 |
1.80±0.86 |
2.419±0.93 |
(0.48,1.37) 0.81 |
0.429 |
(0.36, 1.22) 0.67 |
0.192 |
|
Median(IQR) |
2.21(1.21) |
1.71(1.51) |
2.39(0.68) |
|||||
|
AIP |
Mean±SD |
0.58±0.19 |
0.48±0.15 |
0.72±0.62 |
(0.83,1.60) 1.15 |
0.398 |
(0.67, 1.86) 1.11 |
0.678 |
|
Median(IQR) |
0.59(0.27) |
0.53(0.33) |
0.61(0.23) |
|||||
|
LCI |
Mean±SD |
70847.5±41187 |
36212±19506.6 |
57526.2±37489 |
(0.74,1.02) 0.87 |
0.095 |
(0.71, 1.01) 0.84 |
0.068 |
|
Median(IQR) |
68532(70911) |
36365.5(24386) |
52158.5(64876) |
|||||
|
LAP |
Mean±SD |
6419.1±2917.7 |
5157.3±2685.3 |
7169.8±2652.6 |
(0.85,1.24) 1.03 |
0.788 |
(0.86, 1.26) 1.01 |
0.905 |
|
Median(IQR) |
6068(3289) |
5013(5350) |
8512(4294) |
|||||
Abbreviations: See Table 2
Predictive value of CPs
Predictive value of CPs in fibrosis
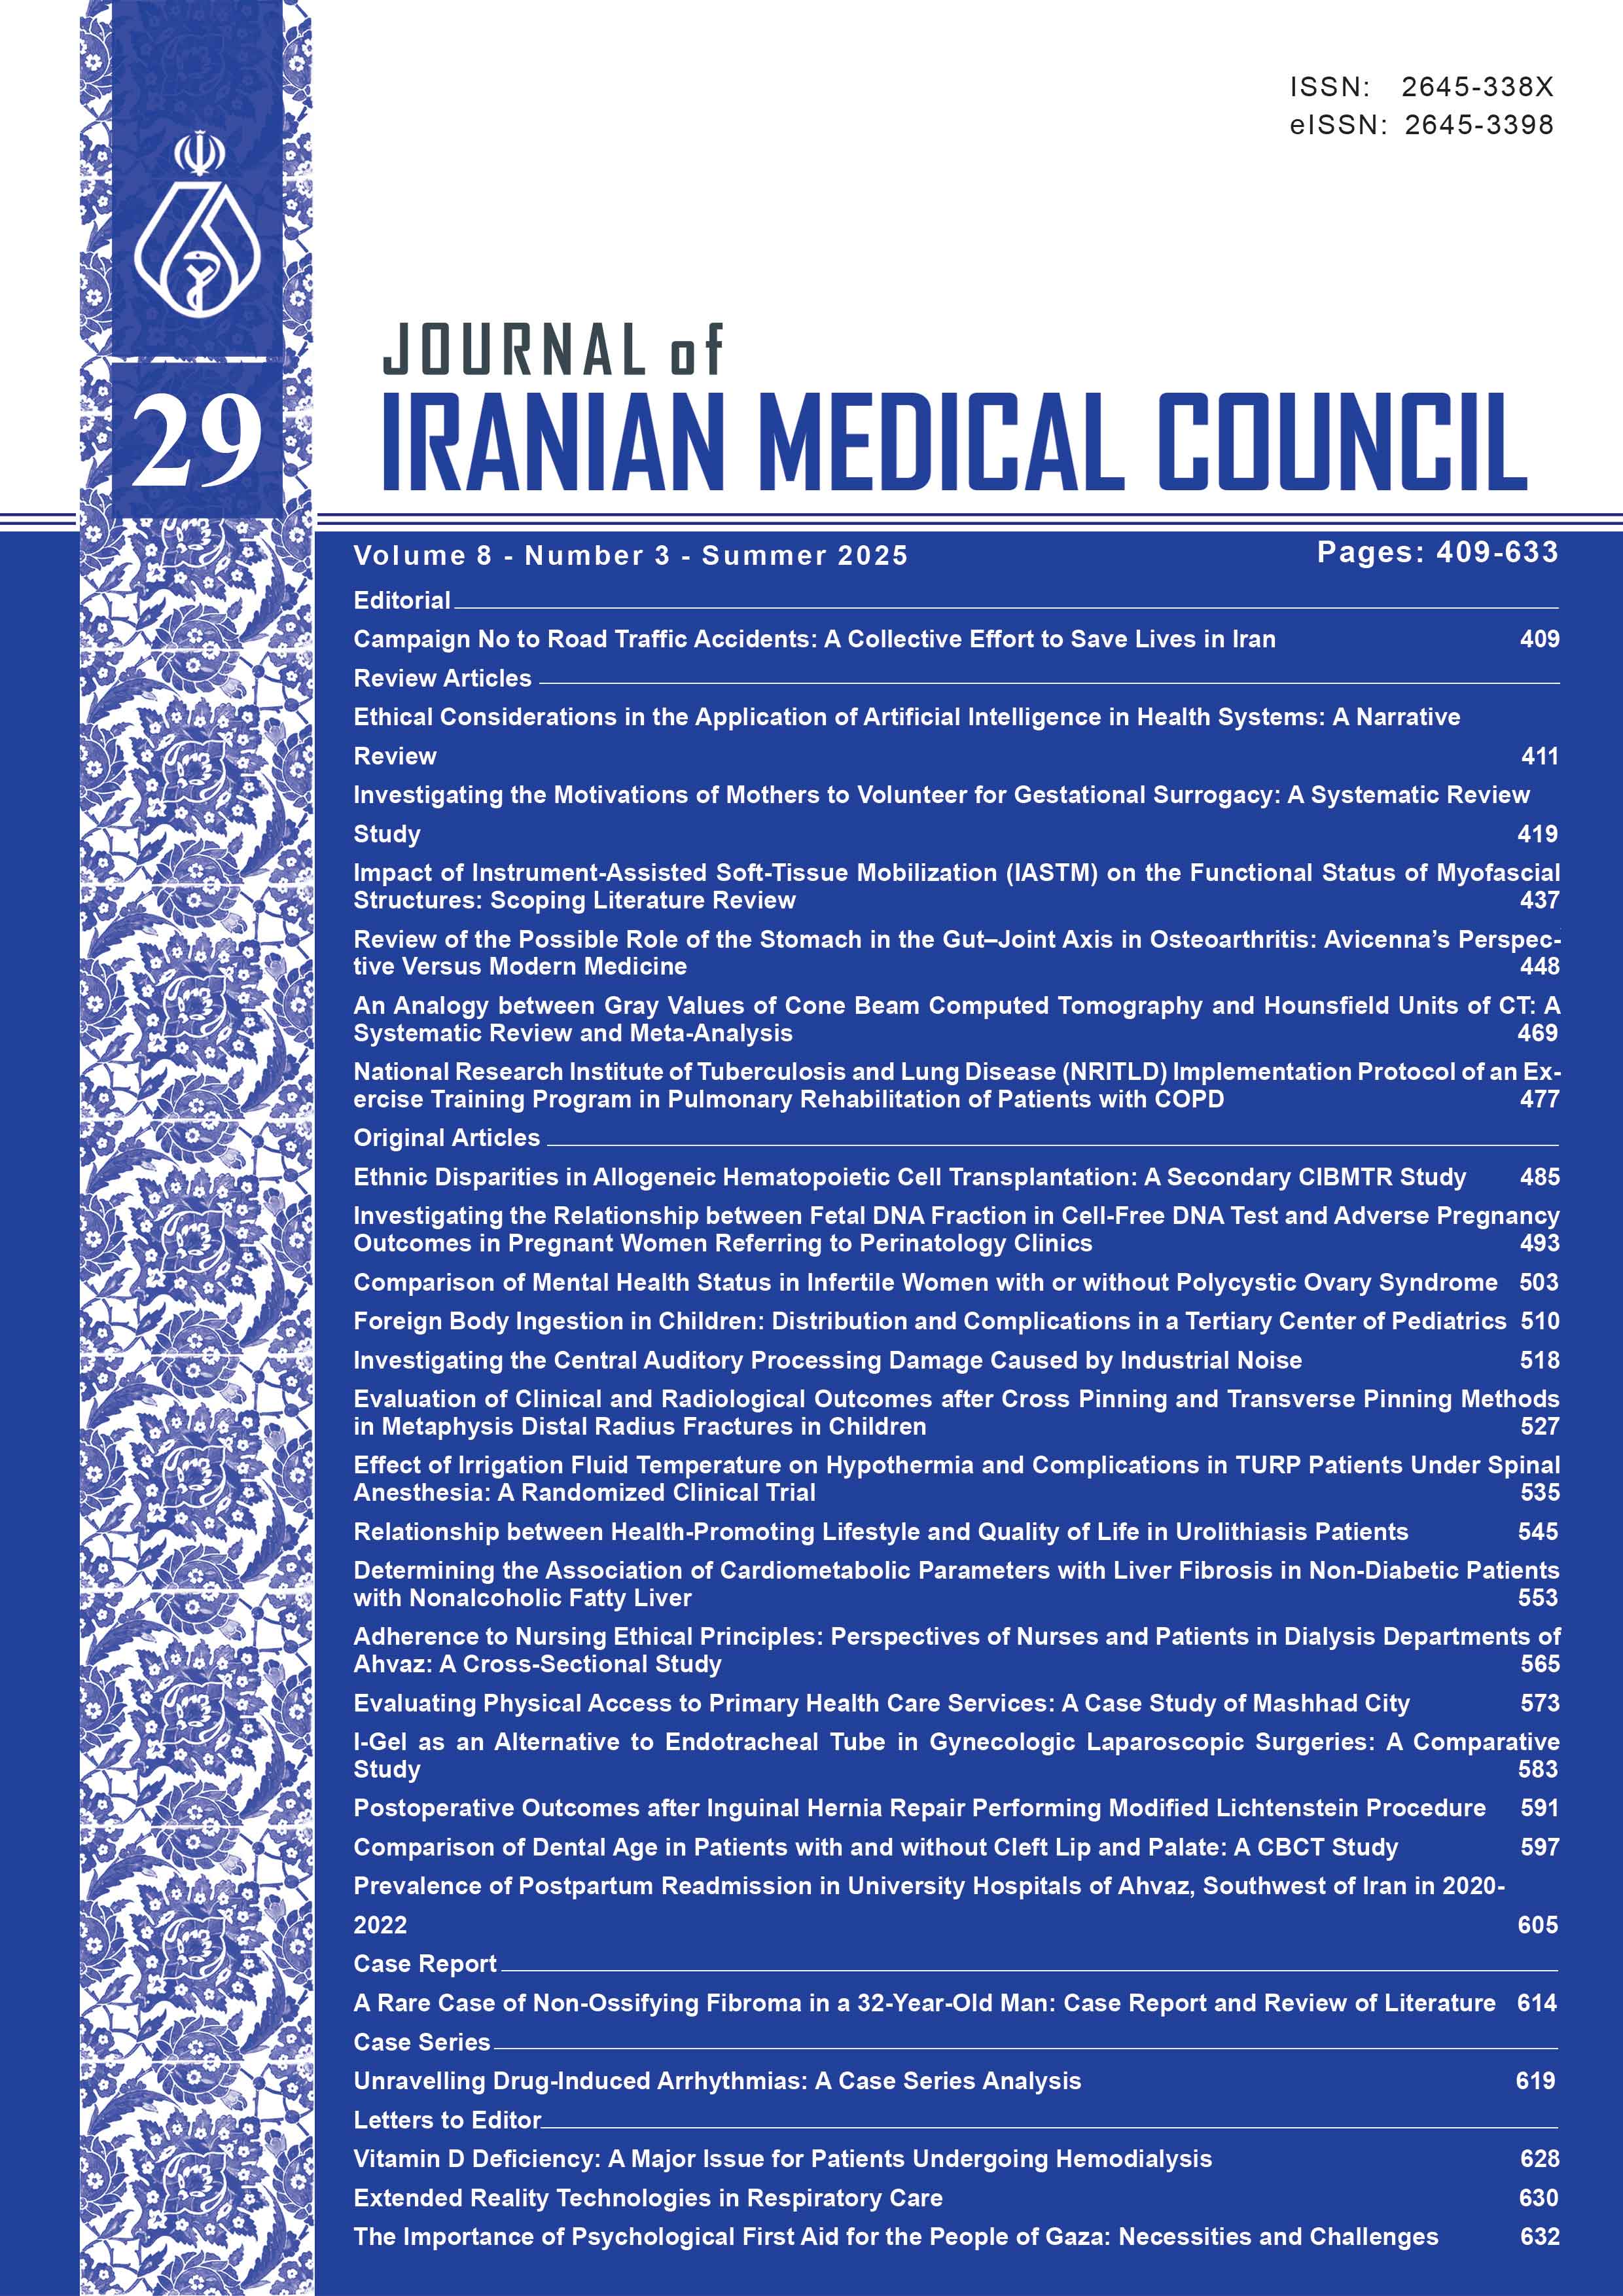
The Area Under the Curve (AUC) for the AIP index was 0.6 (95% CI: 0.574-0.722) (p-value=0.010). 0.52 was the best cutoff for diagnosing higher fibrosis grades (F3 and F4). The sensitivity and specificity of this cutoff point were 66.6% and 57.8%, respectively (Table 7) (Figure 1A). Meanwhile, the AIP has no PV for low fibrosis grades due to the low AUC. The AUC level for the CMI for F3 and F4 was 0.6 (95% CI: 0.56-0.709) (p-value=0.028). The number 2.16 was the best cutoff to detect F3 and F4. The sensitivity and specificity of this cutoff point were 66.6% and 53.29%, respectively (Table 7) (Figure 1B). However, for low fibrosis grades, it had no PV due to low AUC. In contrast, the LAP (p-value=0.073) and LCI (p-value=0.248) indexes had no PV due to the low level of AUC, even in high fibrosis grades (p-value >0.05) (Figures 1C and 1D).
Predictive value of CPs in Steatosis
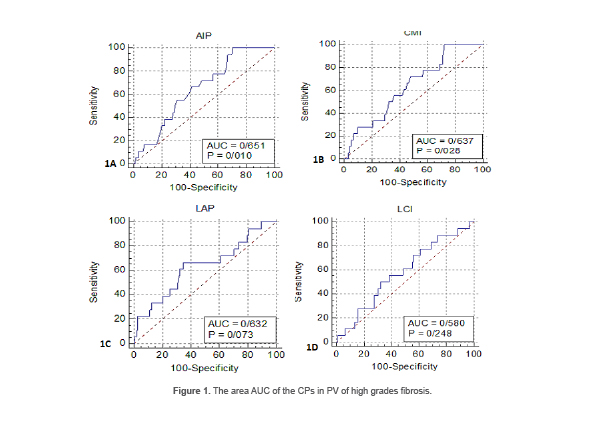
It was found that all the CPs indexes had no PV due to the low level of AUC, even in high grades of steatosis (Grade 3) AIP (p-value=0.466), CMI (p-value=0.410), LCI (p-value=0.990), and LAP (p-value=0.099) (Figures 2A-2D).
Evaluating the association between APs with fibrosis and steatosis
The association between APs and fibrosis
Based on the cutoff, the patients were classified into two and three groups. Univariable analysis showed that patients with BMI≥30 have higher odds for F3 and F4 than both patients with BMI<25 [OR=5.03 95% CI (1.74, 14.58)] (p-value=0.003) and patients with BMI=25-29.9 [OR (95%CI) =1.87 (0.91, 3.82)] (p-value=0.087). However, no significant differences were observed for WC (p-value=0.592), WHR (p-value=0.431), WHtR (p-value=0.124), and BMI<30 (p-value=0.074) (Table 8). In the multivariate analysis, it was found that patients with BMI=25-29.9 [OR=3.34 95% CI (1.07, 10.46)] (p-value=0.038) and BMI≥30 [OR=7.06 95%CI [2.29, 21.77)] (p-value=0.001) had significantly higher odds for high-grade fibrosis than BMI<25 (Table 8). Also, this significant difference was observed between BMI=25-29.9 and BMI≥30 [OR=2.11 95%CI (1.01, 4.41)] (p-value=0.001).
Further univariate and multivariate analysis revealed that patients with higher than cutoff of WC [OR=3.07 95%CI (1.38, 6.83)] (p-value=0.006), WHR [OR=3.96 95%CI (1.48, 10.61)] (p-value=0.006), WHtR [OR=2.79 95%CI (1.08, 7.21)] (p-value=0.034) have higher odds for fibrosis development (Table 9). Meanwhile, patients with a BMI≥30 have higher odds for fibrosis [OR=3.86 95%CI (1.40, 10.64)] (p-value=0.009). Further analysis showed that patients with BMI≥30 have significantly higher odds for fibrosis than patients with BMI=25-29.9 [OR=3.26 95%CI (1.35, 7.85)] (p-value =0.008) (Table 9).
The association between APs and steatosis
Univariate analysis showed that there were no associations between APs, including WC (p-value=0.687), WHR (p-value=0.687), WHtR (p-value=0.438), and BMI (p-value=0.074) with steatosis severity (Table 10). In the multivariate analysis, no significant associations were found between CPs and WC (p-value=0.993), WHR (p-value=0.993), WHtR (p-value=0.691), and BMI (p-value=0.225) with steatosis severity (Table 10).
Further multivariate analysis indicated that patients with WC ≥90 have 4.81 more odds for steatosis development [OR=4.81 95%CI (1.51, 15.34)] (p-value=0.008). In comparison, WHR (p-value=0.164), WHtR (p-value=0.621), and BMI (p-value=0.056) have no association with steatosis development (Table 11).
Table 7. The PV of AIP and CMI in high fibrosis grades
|
95% CI |
-PV |
95% CI |
+PV |
-LR |
+LR |
95% CI |
Specificity |
95% CI |
Sensitivity |
Parameters |
|
3.6-88.96 |
93.6 |
4.5-11.21 |
15.8 |
0.58 |
1.58 |
49.6-65.8 |
57.8 |
41.7-86 |
66.6 |
AIP |
|
4.3-87.96 |
93.1 |
5.6-10.19 |
14.5 |
0.63 |
1.43 |
45.4-61 |
53.29 |
41.7-86 |
66.6 |
CMI |
Table 8. Univariate and multivariate analysis of the association between APs and fibrosis severity
|
Univariable |
Multivariant |
||||||||
|
Parameters |
F1 |
F2 |
F3 |
F4 |
OR (95% CI) |
p-value |
OR (95% CI) |
p-value |
|
|
WC |
<90 |
12(50) |
6(25) |
1(4.2) |
5(20.8) |
Baseline |
0.592 |
(0.62,3.85) 1.55 |
0.630 |
|
≥90 |
43(43) |
21(21) |
23(23) |
13(13) |
(0.54,2.93) 1.26 |
||||
|
WHR |
≤0.88or0.83 |
7(63.6) |
1(9.1) |
0(0) |
3(27.3) |
Baseline |
0.431 |
(0.47,6.87) 1.79 |
0.548 |
|
>0.88or0.83 |
48(42.5) |
26(23) |
24(21.2) |
15(13.3) |
(0.46,6.29) 1.69 |
||||
|
WHtR |
≤0.5 |
5(38.5) |
2(15.4) |
0(0) |
6(64.2) |
Baseline |
0.124 |
(0.12,1.38) 0.4 |
0.976 |
|
>0.5 |
50(45) |
25(22.5) |
24(21.6) |
12(10.8) |
(0.12,1.29) 0.4 |
||||
|
BMI |
<25 |
17(73.9) |
2(8.7) |
0(0) |
4(17.4) |
Baseline |
0.074 |
- |
0.893 |
|
25-29.9 |
23(48.9) |
10(21.3) |
7(14.9) |
7(14.9) |
(0.91,8.01) 2.70 |
(1.07,10.46) 3.34 |
0.038 |
||
|
≥30a |
15(27.8) |
15(27.8) |
17(31.5) |
7(13) |
(1.74,14.58) 5.03 |
0.003 |
(2.29,21.77) 7.06 |
0.001 |
|
a: OR (95% CI) = 1.87 (0.91, 3.82), p-value = 0.087
WC: Waist Circumference, BMI: Body Mass Index, WHR: Waist-To-Hip Ratio, WHtR: Waist-to-Height Ratio
Table 9. Univariate and multivariate analysis of the association between APs and fibrosis (two modes)
|
Univariable |
Multivariable |
||||||
|
Parameters |
No |
Yes |
OR (95% CI) |
p-value |
OR (95% CI) |
p-value |
|
|
WC |
<90 |
17(41.5) |
24(58.5) |
Baseline |
0.019 |
Baseline |
0.006 |
|
≥90 |
29(22.5) |
100(77.5) |
2.44(1.16,5.15) |
3.07(1.38,6.83) |
|||
|
WHR |
≤0.88or0.83 |
11(50) |
11(50) |
Baseline |
0.012 |
Baseline |
0.006 |
|
>0.88or0.83 |
35(23.6) |
113(76.4) |
3.23(1.29,8.08) |
3.96(1.48,10.61) |
|||
|
WHtR |
≤0.5 |
10(43.5) |
13(56.5) |
Baseline |
0.062 |
Baseline |
0.034 |
|
>0.5 |
36(24.5) |
111(75.5) |
2.37(0.96,8.57) |
2.79(1.08,7.21) |
|||
|
BMI |
<25 |
13(36.1) |
23(63.9) |
Baseline |
0.813 |
Baseline |
0.699 |
|
25-29.9a |
24(33.8) |
47(66.2) |
1.11(0.48,2.56) |
1.19(0.5,2.81) |
|||
|
≥30b |
9(14.3) |
54(85.7) |
3.39(1.28,9.04) |
0.015 |
3.86(1.40,10.64) |
0.009 |
|
a: OR (95%CI) =3.06 (1.3, 7.24), p-Value=0.011 (univariable)
b: OR (95%CI) =3.26 (1.35, 7.85), p-value=0.008 (multivariable)
WC: Waist Circumference, BMI: Body Mass Index, WHR: Waist-To-Hip Ratio, WHtR: Waist-to-Height Ratio
Table 10. Univariate and multivariate analysis of the association between CPs and APs with steatosis severity
|
Univariable |
Multivariant |
|||||||
|
Parameters |
S1 |
S2 |
S3 |
OR (95% CI) |
p-value |
OR (95% CI) |
p-value |
|
|
WC |
<90 |
2(50) |
2(50) |
0(0) |
Baseline |
0.687 |
(0.14,7.23)1.01 |
0.993 |
|
≥90 |
23(51.1) |
10(22.2) |
12(26.7) |
(0.23,9.05)1.46 |
||||
|
WHR |
≤0.88or0.83 |
2(50) |
2(50) |
0(0) |
Baseline |
0.687 |
(0.14,7.23)1.01 |
0.993 |
|
>0.88or0.83 |
23(51.1) |
10(22.2) |
12(26.7) |
(0.23,9.05)1.46 |
||||
|
WHtR |
≤0.5 |
3(60) |
2(40) |
0(0) |
Baseline |
0.438 |
(0.21,10.41)1.49 |
0.691 |
|
>0.5 |
22(50) |
10(22.7) |
12(27.3) |
(0.34,11.75)3.01 |
||||
|
BMI |
<25 |
1(20) |
3(60) |
1(20) |
Baseline |
0.426 |
Baseline |
- |
|
25-29.9b |
13(54.2) |
5(20.8) |
6(25) |
(0.1,2.64)0.51 |
(0.05,2.06)0.31 |
0.225 |
||
|
≥30 |
11(55) |
4(20) |
5(25) |
(0.09,2.68)0.5 |
0.420 |
(0.06,2.38)0.37 |
0.293 |
|
a: OR (95% CI) =1.02 (0.32, 3.24), P-Value= 0.967
WC: Waist Circumference, BMI: Body Mass Index, WHR: Waist-To-Hip Ratio, WHtR: Waist-to-Height Ratio
Table 11. Univariate and multivariate analysis of the association between APs with steatosis (two modes)
|
Univariable |
Multivariable |
||||||
|
Parameters |
No |
Yes |
OR (95% CI) |
p-value |
OR (95% CI) |
p-value |
|
|
WC |
<90 |
37(90.2) |
4(9.8) |
Baseline |
0.004 |
Baseline |
0.008 |
|
≥90 |
84(65.1) |
45(34.9) |
4.96(1.66,14.79) |
4.81(1.51,15.34) |
|||
|
WHR |
≤0.88or0.83 |
18(81.8) |
4(18.2) |
Baseline |
0.245 |
Baseline |
0.164 |
|
>0.88or0.83 |
103(69.6) |
45(30.4) |
1.97(0.63,6.14) |
2.37(0.7,7.99) |
|||
|
WHtR |
≤0.5 |
18(78.3) |
5(21.7) |
Baseline |
0.423 |
Baseline |
0.621 |
|
>0.5 |
103(70.1) |
44(29.9) |
1.54(0.54,4.40) |
1.32(0.44,3.95) |
|||
|
BMI |
<25 |
31(86.1) |
5(13.9) |
Baseline |
0.034 |
Baseline |
0.056 |
|
25-29.9a |
47(66.2) |
24(33.8) |
3.17(1.09,9.18) |
2.94(0.97,8.86) |
|||
|
≥30b |
43(68.3) |
20(31.7) |
2.88(0.98,8.52) |
0.055 |
2.57(0.83,7.93) |
0.100 |
|
a: OR (95% CI) =1.2 (0.53, 2.26), p-value=0.8
b: OR (95% CI) =1.14 (0.35, 2.46), p-value= 0.733
WC: Waist Circumference, BMI: Body Mass Index, WHR: Waist-To-Hip Ratio, WHtR: Waist-to-Height Ratio
Discussion
Ultrasonography is frequently used for NAFLD identification. However, higher BMI and low steatosis (<20%) limited its sensitivity (19). In the present study, it was aimed to investigate the PV and association between CPs with fibrosis and steatosis in patients with NAFLD.
The findings demonstrated no association between CPs, fibrosis, and steatosis in subjects with NAFLD. In contrast, Zou et al, by evaluating the 14251 patients, showed the relationship between CPs and NAFLD (20). This inconsistency can be due to the sample size. As mentioned earlier, nationality and race cause the heterogeneity between investigations. In this regard, inconsistent with the present study, Kim et al indicated that the TG/HDL-C ratio correlates with insulin resistance in the white race, while it does not have valuable prognostic accuracy in Hispanic and African-American races (21).
The data indicated that men’s mean of CMI, AIP, and LAP are significantly higher. Cai et al suggested that the AIP is higher in men (22). In contrast, it was demonstrated that in the Chinese population, the CMI and LAP are significantly higher in females (20,23). However, the CPs are influenced by sex hormones (24).
Also, the correlation between higher WHR and WHtR with fibrosis development in NAFLD was observed. This finding is in line with Sheng et al’s results (25). Among APs, WC and BMI are obesity grading parameters. However, BMI cannot distinguish between fat and muscle mass (24), whereas WC, by measuring middle fat, can better represent fat distribution. In this line, it was found that in rural Indians, WC is directly associated with steatosis prevalence even with lower BMI (26). This agrees with our findings that WC ≥90 is associated with steatosis and fibrosis.
No associations were observed between CPs with fibrosis and steatosis development in NAFLD, whereas Li et al showed a direct association between LAP and triglyceride-related parameters in predicting metabolic syndrome (27). Finally, CMI and AIP indexes had diagnostic power for grades 3 and 4 of fibrosis. However, there was no clear conclusion about the cutoff of CPs for predicting NAFLD between different races. Giannini et al have shown these differences in the TG/HDL-C ratio between different ethnicities (28).
Insulin resistance and oxidative stress are the primary mechanisms in NFLD pathogenesis (29). Hyperinsulinemia disrupts lipid metabolism, which is accompanied by increasing free fatty acids in the liver, disruption in mitochondrial beta-oxidation, new lipogenesis, and reducing fat exclusion from the liver (30,31). However, some authors have shown that hyperinsulinemia in NAFLD decreases insulin extraction by the liver (32,33). Additionally, insulin resistance is directly associated with fat mass (34). On the other hand, impaired glycemic control in diabetes mellitus leads to decreased HDL and increased LDL and TG (35). In the present survey, it was found that CMI and AIP have PV in F3 and F4 grades, which may be a consequence of insulin resistance. Hence, the role of hyperglycemia and hyperinsulinemia in increasing CPs becomes more prominent. In accordance with this, it was found that the CPs have PV in diabetic patients with NAFLD with hyperinsulinemia (36).
The low sample size is the main limitation of this study. Comparing diabetic and non-diabetic subjects with NAFLD gives more reliable information about PV of CPs in NAFLD that was not investigated in the current study. Finally, evaluating insulin resistance can reveal the involved pathogenesis mechanism in increasing CPs in NAFLD patients.
Conclusion
The present study demonstrated that CPs are not associated with fibrosis and steatosis in non-diabetic NAFLD. The results demonstrated that AIP and CMI have acceptable PV for diagnosing F3 and F4 fibrosis. Also, it was found that WC, WHR, WHtR, and BMI are associated with fibrosis. Finally, WC≥90 was significantly correlated with steatosis.
Ethical Approval (IRB)
The current study is based on the ethical committee of Ahvaz Jundishapur University of Medical Sciences (IR.AJUMS.HGOLESTAN.REC.1401.145).
Informed consent
Informed consent was obtained from all individual participants included in this study.
Availability of data and materials
The datasets used analyzed during the current study are available from the corresponding author on reasonable request.
Funding
None.
Acknowledgement
We thank the patient for his consent to publish the case report. The authors would like to give a special thank you to the colleagues at Golestan Hospital, Ahvaz Faculty of Medical Sciences, for their guidance and encouragement.
Conflict of Interest
There was no conflict of interest in this manuscript.