Document Type : Original article
Abstract
Background: Ensuring equitable access to health services is a primary objective of health systems. This study aimed to evaluate the physical accessibility of Primary Health Care (PHC) facilities in Mashhad city, Iran, in 2022.
Methods: This cross-sectional study utilized geo-spatial analysis, specifically the Two-step Floating Catchment Area (2SFCA) method. The population within a 4 km radius of each of the 83 PHC facilities was calculated using ArcMap software. A checklist for weighting the components of service production in the facility was designed that included three main components (manpower, materials, equipment and space) and 17 sub-components. The differences between geographical areas of the studied city in terms of Accessibility Index were determined using cluster analysis.
Results: All areas of the city were covered by the 4 km buffer zones of PHC facilities and there was no area out of the 4 km buffer zones. In addition, the eastern regions of the studied city, which had lower socio-economic status, enjoyed higher capacity density and access indices. Considering capacity and access indices, physical access to PHC facility across the areas of the city was not equal. In areas with lower socio-economic status, there was better access to services than areas with higher status.
Conclusion: Totally, at least in some areas covered by a PHC system contrary to the popular idea, having good financial situation may prevent a person from accessing some PHC and cause the creation of areas we called them “deprived affluent areas” in this study.
Keywords: Economic status, Primary health care, Health services accessibility, Workforce, Spatial analysis
Introduction
Providing equitable access to health services is one of the main challenges and goals of any health system in all countries (1-3). Access to health services can generally be divided into five categories: availability, physical accessibility, affordability, acceptability, and compliance (4,5) accessibility, acceptability and quality (AAAQ). According to general comment no 14 of International Covenant on Economic, Social and Cultural Rights 1966 “health facilities, goods and services must be within safe physical reach for all sections of the population, especially vulnerable or marginalized groups, such as ethnic minorities and indigenous populations, women, children, adolescents, older persons, persons with disabilities and persons with HIV/AIDS”. Accessibility implies that medical services are within safe physical reach of everyone (6). World Health Organization (WHO) and United Nations Educational, Scientific and Cultural Organization (UNESCO) strongly advise health systems to address discrimination in policies and practices, including in the distribution and provision of health resources and services (7,8).
So far, many studies have shown the relationship between poverty and lack or limitation of access to health services (9,10). Therefore, efforts have been made to improve various forms of accessibility, including physical accessibility, and health facilities be located in a way in a given geographical area that provides the best access (11). Low access to health facilities leads to low use of services and reduced efficiency (12). The access is also important in strengthening and developing the referral system as by providing acceptable access to health facilities, it is possible to prevent surge of patients to hospitals (13). Understanding the geo-spatial distribution of health centers can help health service administrators better evaluate the efficiency of health network in a geographical area and recognize areas with high or low access where new centers need to be established (14). Among the studies conducted in this field, in the study of Murad (15) aimed to determine access to health facilities in the city of Jeddah, Saudi Arabia, first, a geographical database was created using the Geographic Information System (GIS) that included the location of health facilities, road networks and the population size of different areas of the city. Analysis of driving-time and Euclidean distance were used for assessing spatial distribution of health facilities and accessibility. Findings of this study showed that 30% of the population of Jeddah had very good access (maximum 5 minutes driving) to health facilities, while 70% of the residents had less access (15). Another study by Paez et al (16) examined the access to health facilities for the elderly and non-elderly in Montreal, Iceland. Real travel distances were used to determine the access status, which gives a better estimate of the movement of people and their geographical access to a specific place (health facility) compared to direct (Euclidean) distance. The results of the study indicated a significant inequality between the people (both elderly and non-elderly) living in suburbs and central areas of the city in terms of access to health facilities (16).
The main latent limitation of these two studies, and many other similar studies that examine physical access using GIS, (17) regardless of what method is used to assess the geographic distribution and accessibility, is about the essence of what should be measured. For example, in the methods such 2 Step Floating Catchment Area (2SFCA), the capacity of health facility is a matter. Murad (15) assessed the access to PHC centers just by considering human resources variables such as the number of physicians, nurses or radiology staff and no other aspects of capacity. In Paez’s study (16), the capacity of all studied facilities was assumed to be the same, which is not necessarily always true. This shortcoming can be observed even in non-GIS studies in the field of physical access to Primary Health Care (PHC), as in a survey conducted in 34 European countries in 2011, the concept of accessibility to PHC was limited to the access to General Practitioners (GPs) (17). Given the importance of physical access to PHC facilities and the shortcomings of previous studies addressed above, the first aim of the present study was to determine the capacity of PHC facilities. The second aim was to assess the physical access to PHC facilities in Mashhad city, Iran, in 2022.
Materials and Methods
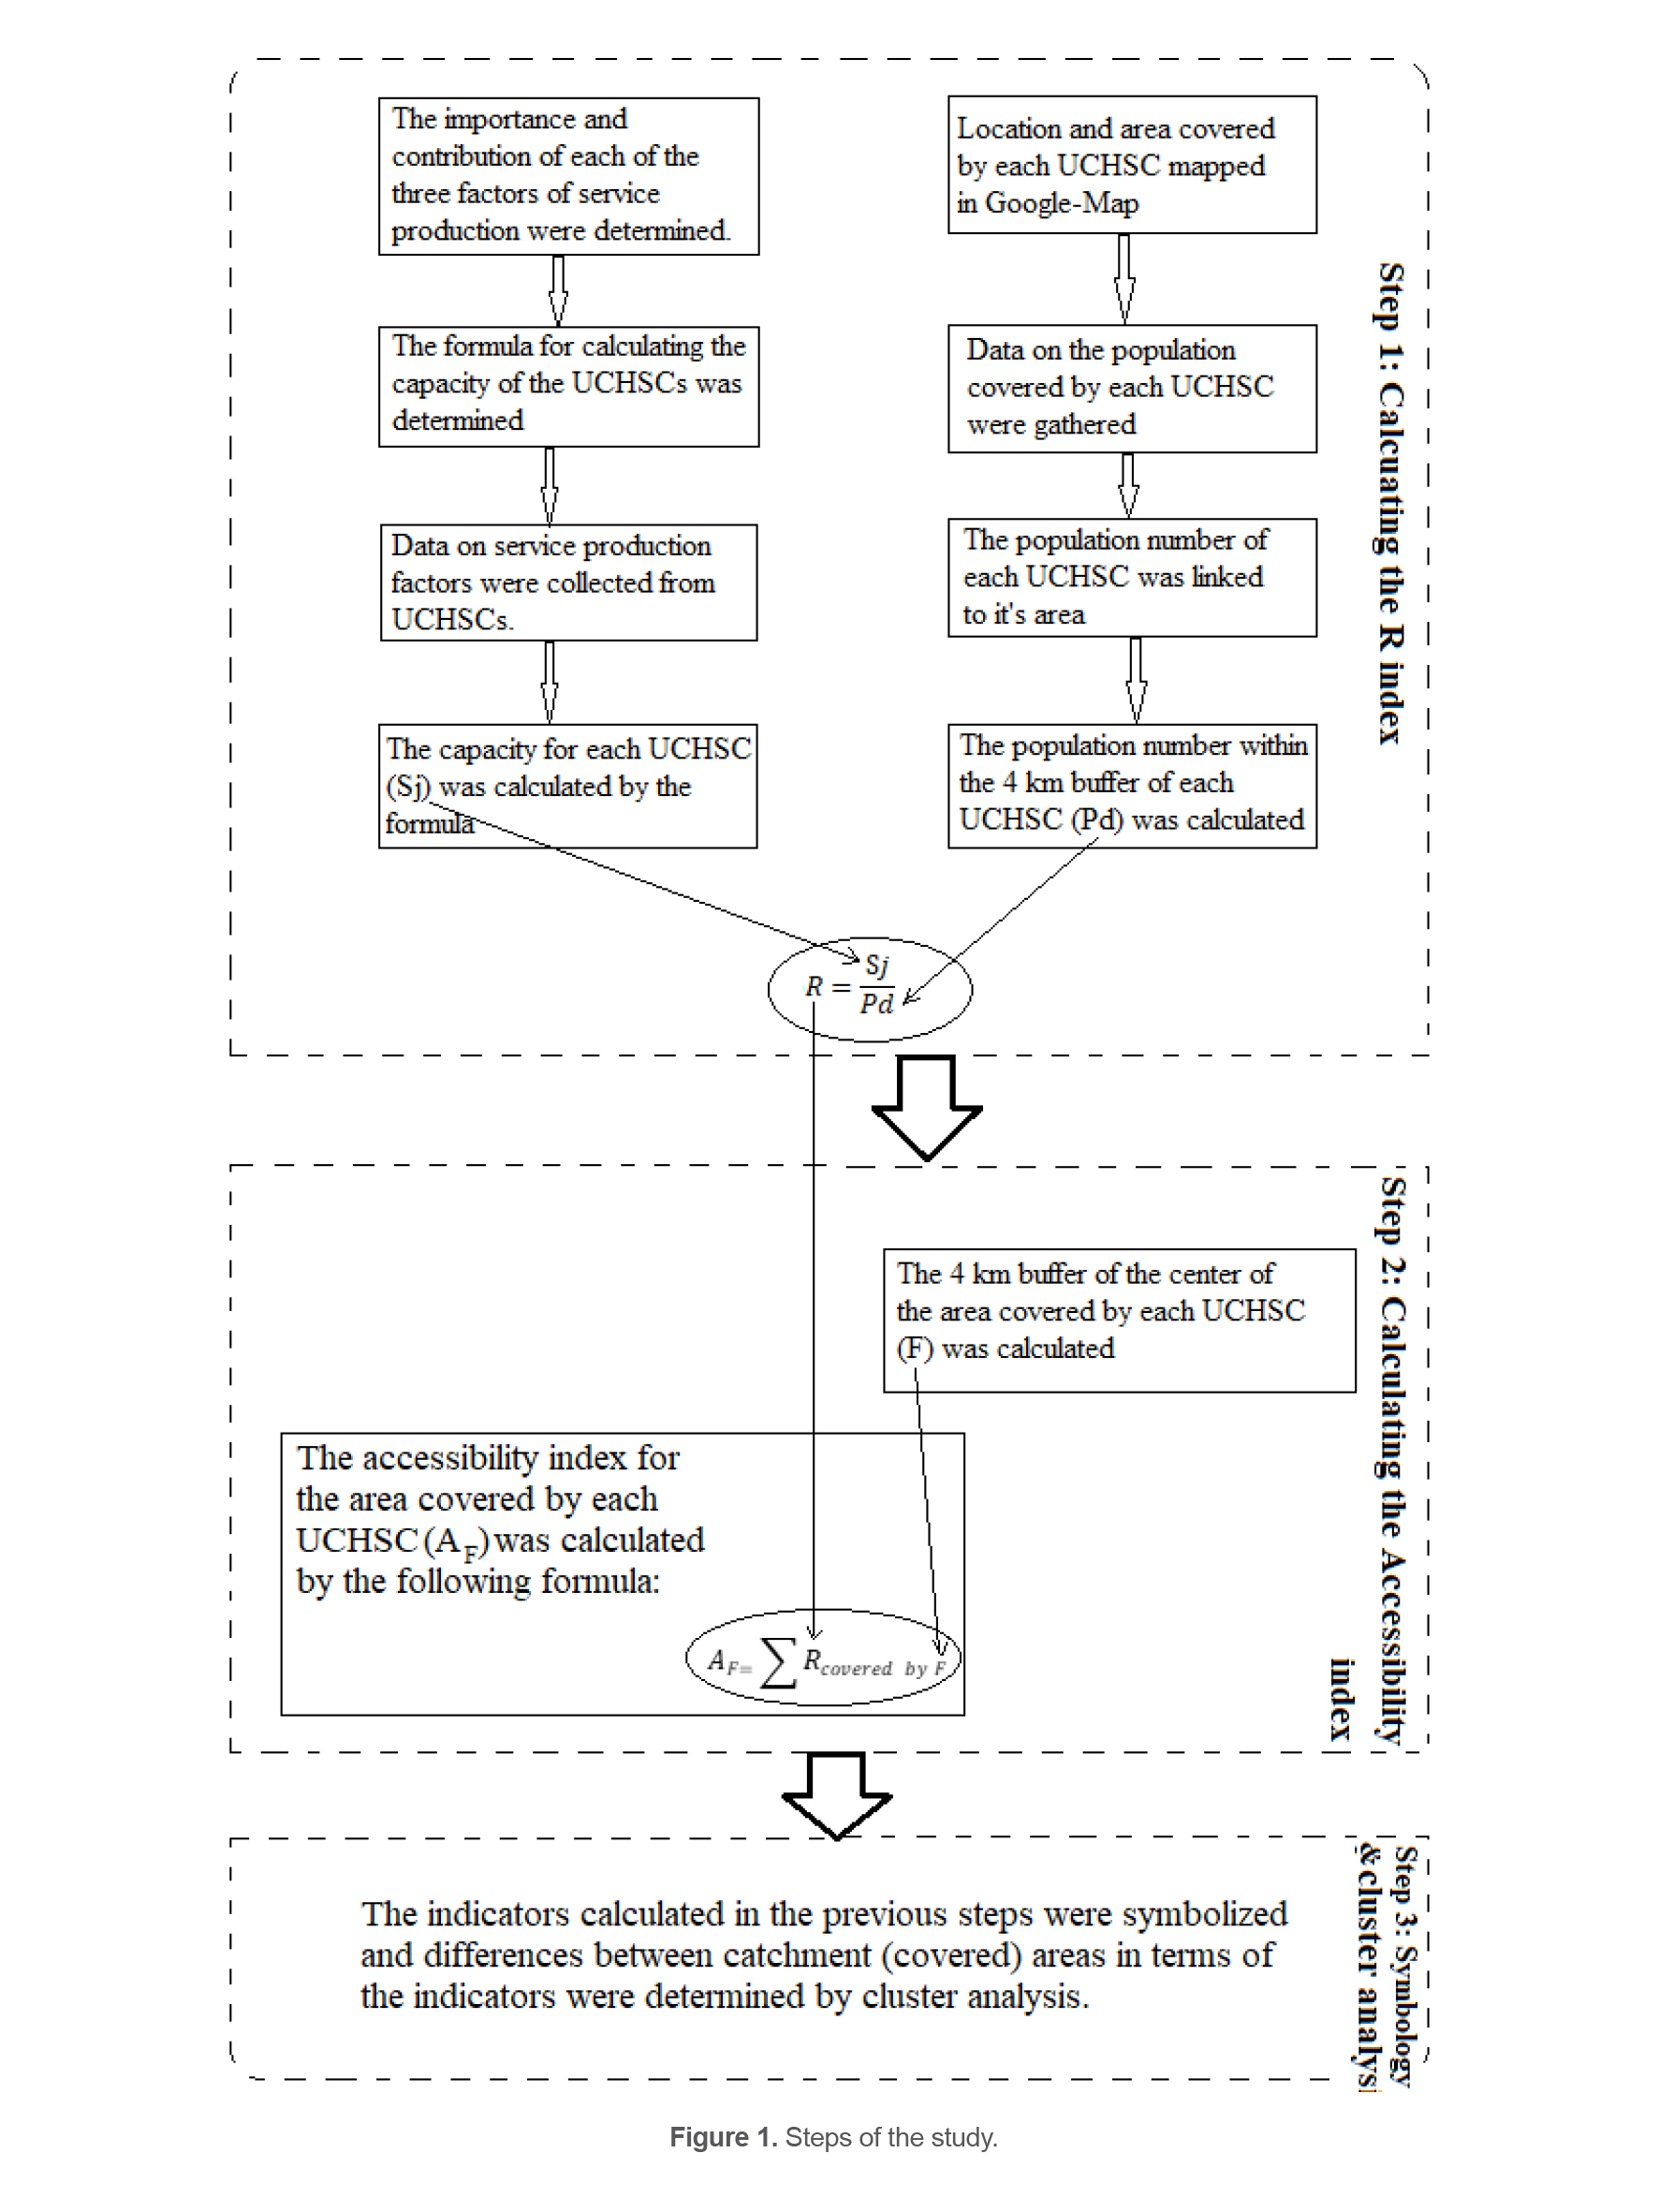
This study is based on geo-spatial analysis to assess accessibility to urban health centers in the study area that was Mashhad city of Iran. The method used was the popular two-step floating catchment area (2SFCA) (18). It was initially developed to evaluate the spatial inequity of health care services, but it has been further applied to other urban planning and facility access issues (19). Flowchart of the study which shows different steps of the study is shown in figure 1.
Setting
Iran is located in the Middle East and is a developing country with a population of 87 million (20). Health services are delivered by a three-level health network in the country. At the first level, PHC are delivered by Urban Comprehensive Health Service Centers (UCHSC) and Urban Health Posts in urban areas (21). Mashhad is the second big city of Iran and the capital of Khorasan Razavi Province. Mashhad is the hub of religious tourism on a large scale. The city has a population of more than 3370000 (22). The area of the city is 351 square kilometers and 83 UCHSC have been established to provide PHC for the residents in this area. UCHSCs are supervised and covered by five headquarters, namely Health Centers (HC).
Data collection and analysis
As shown in figure 1, this study was conducted in three steps that are explained in the following paragraphs.
Step 1: Calculating the R index
The formula for calculating the R-index as shown in figure 1 was a fraction (23). The numerator of this fraction was the capacity of each of the UCHSC (Sj). The denominator of the fraction was the number of people living within the 4 km buffer zone of each UCHSC (Pd). In order to calculate Pd, service coverage area of each UCHSC was recognized and zoned on Google Map. Also, the location of each UCHSC was pointed on the map. Then, demographic information, i.e., the number of populations covered by each UCHSC was gathered from the HCs and linked to the points of UCHSCs on the prepared map. Finally, the population in the 4 km buffer of each UCHSC (Pd) was calculated using ArcMap software.
The reason behind considering 4 km for the radius of buffer zone was the standards of the Iranian Health Network. According to these standards, in any climatic and geographical situation, the most remote places of residence and work of the people should not be more than one hour walk away from the nearest health care facility (e.g. UCHSC) (24). One hour of walking is equal to 4 km (25).
In order to calculate Sj, since no previous study was found in this field, the importance and proportion of each component of service production in UCHSC had to be determined. To start, a checklist was designed for weighting the components of service production in UCHSC. Initially, a bank of items and dimensions of health service production was formed through literature review to create the checklist. This bank was provided to 10 experts in the field, and their opinions on the dimensions and items of the checklist were obtained. After consolidating the opinions, the final approved checklist was formed, which included three main components: manpower, equipment, and physical space, as well as 17 sub-components. The checklist can be found in attachment 1.
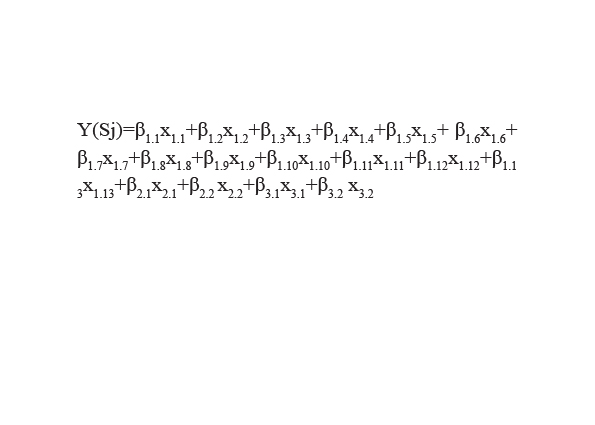
Next, the checklist was presented to 21 experts who were asked to rank the importance and specify the percentage contribution of each main component and sub-component to service production at a UCHSC. The experts included senior and executive managers of the Provincial Health Department of Khorasan Razavi and faculty members of the Department of Management Sciences and Health Economics at Mashhad University of Medical Sciences. The data collected from the questionnaires were analyzed using Principal Component Regression, resulting in the formula:
In this formula, β represents the weight of the sub-component x. This formula was used to calculate the capacity of a UCHSC, denoted as Sj. More detailed information about the formula is provided in attachment 2. After collecting the necessary data such as the number of physicians and nurses, roofed area, etc., Sj was calculated for each UCHSC. It is important to note that the type and amount of equipment in each UCHSC were proportional to the manpower (e.g., a UCHSC with two doctors had two stethoscopes). Therefore, in the Sj formula, the value of one was assigned to equipment sub-components for all UCHSCs. Additionally, since the values of physical space sub-components (roofed area and total area in square meters) were much larger than the number of manpower sub-components in each UCHSC, using the original values in the Sj formula would result in an inflated contribution of physical space. To address this, standardized values (Z-score) of areas were used instead of their original values. This data analysis was conducted using SPSS v. 20 software.
After calculating Sj, the R index was determined for each UCHSC using the formula:
Step 2: Calculating the Accessibility Index
At first, the central point of the area covered by each UCHSC were identified by ArcMap software, and a 4 km buffer zone was determined for each central point. Then, the value of the Accessibility Index was calculated for the area covered by a UCHSC, which was equal to the sum of the values of R indices that were placed in the 4 km buffer zone of the central point.
Step 3: Symbology and Cluster Analysis
In the last step, the differences between geographical areas of the city in terms of Accessibility Index were determined using cluster analysis. Cluster analysis and visualization of the differences were performed by ArcMap software. If the p-value was equal or less than 0.05, it was considered significant.
Results
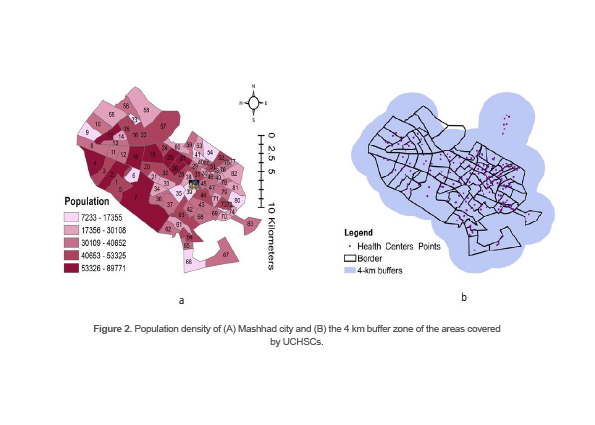
To assess the physical accessibility of UCHSCs, several variables such as population density and the capacity of centers were measured and 4 km buffer zones were identified. Population density of the areas covered by UCHSCs in the studied city is shown in Figure 2 (a). Darker colors indicate higher density comparing to lighter ones.
As shown in figure 2A, the population density in the areas covered by the centers located in the western areas of the city was higher than the eastern areas. The 4 km buffer zone of each UCHSC is shown in figure 2B. According to the map shown in figure 2B, all areas of the city were covered by the 4 km buffer zones of UCHSCs and there was no area out of the 4 km buffer zones.
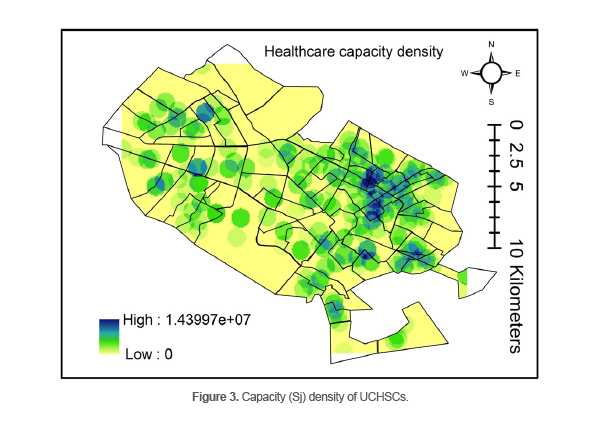
Figure 3 shows the capacity (Sj) density map of UCHSCs. As it can be observed in this figure, the eastern regions of Mashhad had a higher capacity density.
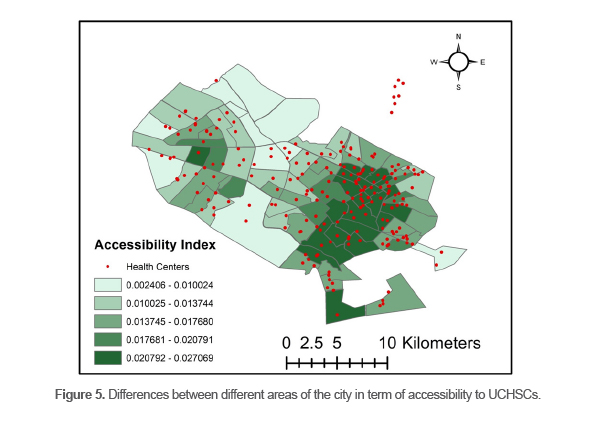
The Accessibility Index of the city UCHSCs is shown in figure 4. As can be seen in this figure, obviously the eastern areas of the city, marked in dark green, had better access to the centers than western and central areas.
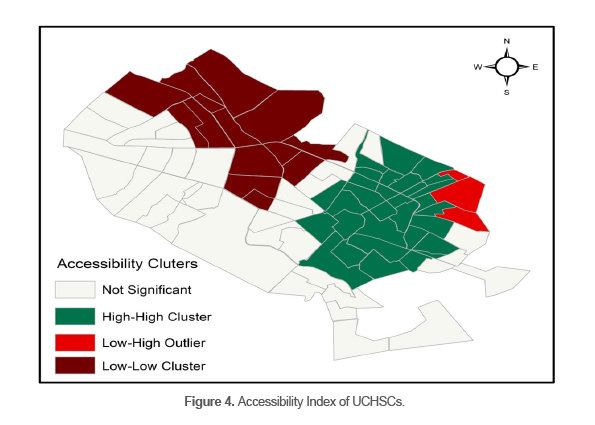
Results of the cluster analysis of access to UCHSCs is shown in figure 5. Although there was no significant difference between many areas of the city in term of access to UCHSCs, two clusters were recognized. One High-High Cluster in the east of the city and one Low-Low Cluster were found in the northwest of the city. Only one Outlier was identified which was located in a corner in the northeast of the city.
Figures 3-5 demonstrate that the geographical distribution of UCHSC capacity, the accessibility index, and the difference in accessibility index across the city are consistent.
Discussion
This study aimed to assess the physical accessibility to UCHSCs in the studied city using 2SFCA method. It showed that physical access to UCHSCs across the areas of the city was not equal. However, if the basis for judging access was only the standards of the Iranian Health Network (the most remote places of residence and working places of people should not be more than one hour walk away from the nearest UCHSCs, which is equal to a 4 km buffer zone), there would be no area in the city without standard access. The study by Kokabisaghi revealed that in general, physical access to PHC services was satisfactory in urban areas of Iran that is line with results of the present study (26). However, it seems a simplistic standard which cannot properly demonstrate the status of physical accessibility. In this regard, the results are consistent with the findings of another study conducted to assess the geographical access to health care centers in Mozambique (27). In that study, travel time to the nearest health care center was calculated using GIS. As in the current study, the standard for physical accessibility was spending less than one hour walking to reach the nearest health facility. In addition, areas without access are defined as the ones whose residents need to spend more than one hour walking to reach the nearest healthcare center. The results of the study in Mozambique suggested that while there was both areas with and without access across the country, there were inequalities within the areas, which is consistent with our results.
According to Crooks and Andrews, standards such as one-hour travel on the surface have limitations, since some roads may not be in good condition, or there may be speed limits, or the network of roads might be congested or not properly designed (28). Rosero-Bixby, (29) who conducted a study to investigate the equity in physical access to health care in Costa Rica, stated that traditional measurements for assessing physical accessibility, which are based on time (or distance) to travel to the nearest health facility, are not comprehensive; and mixed indicators which are consisted of different variables such as the capacity of facility are needed. The capacity index in the eastern areas of the city were higher than the western areas. In addition, there was a significant difference between the eastern and western regions in terms of accessibility index. There was one cluster with higher access in the eastern part of the city and one cluster with lower access in the western part. The findings are not consistent with Rahnama and Amirfakhriyan’s study (30), aimed to assess physical accessibility to health facilities in Mashhad in 2013. The study analyzed access to six categories of health facilities including clinics, hospitals, laboratories, doctors’ offices, emergency centers, and urban health centers using 2SFCA utilized to assess accessibility. The results of the study indicated a lack of conformity between the spatial distribution of the population and the distribution of health services. The central city had the best access to health services, while the surrounding areas were the weakest. This contradiction may be due to the 10-year gap since the study was conducted, leading to better access shifting to the eastern areas. It could also be possible that the accesses were not mapped separately for each group of health facilities. In the current time, the reason for better access in the eastern areas could be attributed to the lower socio-economic situation of the citizens in the eastern areas compared to the western areas. Findings of the study by Mokhtarzadeh et al (31) which was conducted to investigate the relationship between spatial structures and the level of sustainable development in Mashhad, clearly showed that Sustainable Development Index in the eastern regions of the city was lower than the western regions.
It can be argued that the low socio-economic status of residents of eastern regions has resulted in higher demand and use of health services provided by UCHSCs (which are government centers and their services are almost free or cheap) than the western regions. Further demand over time has led officials of the city health network to launch more UCHSs with higher capacities in these areas to meet the higher demand. The findings of the present study in this respect are consistent with the findings of a study conducted in a district in Turkey (32), aimed to assess access to health care facilities. The study found that while there was a concentration of private hospitals in higher-income areas of the district, the distribution of public hospitals was more equal throughout the district (32). Although in first instance, this seems to be an acceptable situation, i.e., more and better access to PHC in areas with lower socio-economic status than areas with higher socio-economic status, but it can be potentially challenging and has its own problems. One of the problems is that the residents of the areas with lower access are being deprived of PHC, regardless of whether they can afford it or not, since PHC are not provided by the private sector. As a result, regardless of the level of demand for such services, the real need for this type of healthcare for people living in these areas may not be met. Thus, a new form for having no or poor access to PHC can be defined as the phenomenon of “deprived affluent areas”. This phenomenon caused mainly by the ignorance of one the important principles in the provision of health care and purposes of PHC that is to meet the needs, not the demands (33).
Jankowski and Brown (34) in their study which aimed to investigate the effects of aggregating population demand for PHC on spatial accessibility to PHC in a state in USA, found that the level of accessibility is directly related to the aggregated demand. In areas where there was more aggregated demand, the level of access was also higher (34). Results of a study performed to evaluate the need (35), demand and supply of PHC in one of the provinces of Argentina indicated that the provision of PHC was not always and necessarily related to the need for it, and PHC was more physically accessible in the areas, where the need for them was less than the other areas.
The main limitation of the present study was the lack of information about the need for PHC and its spatial distribution in the study area. However, it is important to note that the main purpose and scope of this study was to examine the physical access and spatial distribution of PHC facilities, i.e., to examine the provision of PHC and not the need for PHC.
Conclusion
The evidence from this study implies in contrast with common hypothesis, the areas with higher socioeconomic status necessarily did not have better physical access to care. For determining physical access to PHC and equality in access, and making a correct judgment about the favorable or unfavorable access and distribution, not only the comprehensive and combined indices must be used, but also the spatial distribution of the need for care in the studied area should be investigated.
Ethical Considerations
This study was approved by the research ethics committee of Mashhad University of Medical Sciences (code: IR.MUMS.REC.1398.292).
This study was supported by Mashhad University of Medical Sciences (grant No. 981103).
Acknowledgement
The authors thank the health vice of Mashhad University of Medical Sciences for participating in this study. This study was approved by the research ethics committee of Mashhad University of Medical Sciences (code: IR.MUMS.REC.1398.292).
Conflict of Interest
There was no conflict of interest in this manuscript.
https://pubmed.ncbi.nlm.nih.gov/32430028/