Document Type : Original article
Abstract
Background: The improper length and direction of pedicle screw may also cause it to penetrate the adjacent organs. Unknowing the safe zone of dimensions and directions of the pedicles is essential to proper screw placement.
Methods: The present study is a cross-sectional morphometric study on patients with spinal trauma referred to the neurosurgical department in 2021. The MARCO PACS software scale measured the CT scan images and included the vertebral left pedicle diameter, pedicle body distance, body aorta distance, pedicle diameter, height, and area. The entry point and direction of the pedicle screw were made with the “free-hand” method.
Results: 301 patients were included, consisting of 113 females (37.5%) and 188 males (62.5%). The mean age of the participants was 42.87±12.3 years. “Among all T12 vertebra parameters, just body aorta distance was not significant between genders (p-value=0.311). The pedicle height and body aorta distance were lowest among 18-35 years patients (p-value=0.001) (p-value=0.003), respectively. Post-hoc analysis revealed a significant difference between 18-35 and 51-70 years for body aorta distance in the L1 vertebra (p-value=0.002).
Conclusion: The present investigation has shown significant differences between genders for optimal left pedicle screw parameters, which should be considered before surgery.
Keywords: Aorta, Cross-sectional studies, Female, Humans, Male, Pedicle screws, Thoracic vertebrae, Tomography, X-Ray Computed
Introduction
Lesions such as trauma, tumors, and spine infections destroy the posterior formations of vertebra. In these damages, the pedicle screw, due to the immediate strengthening of the spine, is the best choice to speed up patients’ recovery (1). On the other side, the entry point of pedicles’ is the intersection of two lines (the vertical line that passes from the outer edge of the top and the horizontal line that passes through the middle part of the transverse folds), which is not directly visible. Thus, it may have risks and complications such as nerve root, dorsum, or spinal cord damage following the wrong pedicle direction or location. Also, the suitable implication of an improper diameter screw may cause the pedicle to break and subsequently damage the root (2). The improper length and direction of pedicle screw may also cause it to penetrate the adjacent organs (3).
Not injuring pedicle and vertebra body is the gold target during pedicle implication (4). Since the pedicles’ size and shape vary throughout different races, knowing the safe zone and optimal morphometry of pedicles is necessary to improve clinical outcomes. Recent trends in increasing the efficacy of pedicle screw implications have led to a proliferation of studies investigating the influencing factors (5). However, pedicle morphometry is highly dependent on race; in this regard, this study aimed to measure pedicle morphometry in the Iranian population.
Materials and Methods
Study population
The present study is a cross-sectional morpho-metric study on patients with spinal trauma who were referred to the neurosurgical department in 2021. Patients older than 18 years with spinal trauma were included. Younger than 18 years old, spinal deformity, vertebra tumor, vertebra infection, previous pedicle screw, any congenital vertebra disorders, and dissatisfaction of patients in the study participating were considered as the exclusion criteria.
Imaging
All the patients were examined by Computed Tomography (CT) scan before surgery.
Surgery strategy
The surgery strategy was the fixation of left vertebra pedicle screws conducted through the “free-hand” method.
Data collection
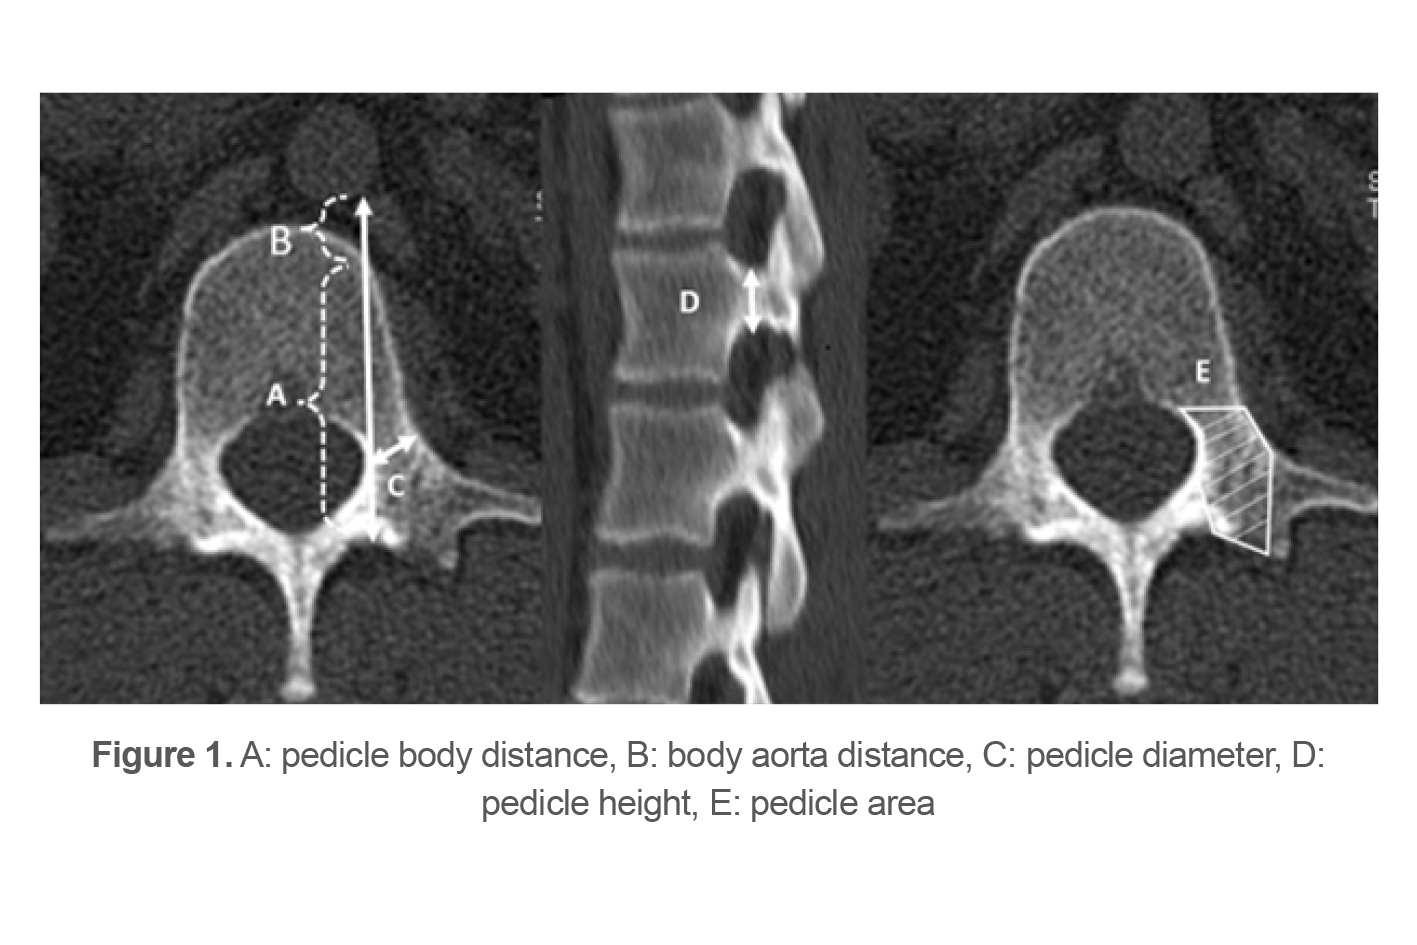
Demographic information of the subjects, including age, sex, trauma mechanism, and Body Mass Index (BMI), was collected. The distance between the pedicle (screw entry point) and aorta (pedicle body distance) (Figure 1A), anterior vertebral body and aorta body aorta distance (Figure 1B), sum of pedicle body distance and body aorta distance diameter (Figure 1C), height (Figure 1D), and area pedicles (Figure 1E), were measured through MARCO PACS (METRIC V10.1) software scale.
Statistical analysis
The Chi-square test was used to determine the relationship between qualitative variables between the case and control data. The Odds Ratio (OR) with a 95% confidence interval (95%CI) was calculated. A p-value was considered less than 0.05 (p-value <0.05). An unconditional logistic regression analysis was used to control possible confounding factors. Data management and analysis were performed using SPSS software (V24).
Table 1. The demographic information of the included studies
|
Parameters |
Frequency(%) |
|
Participations |
301(100) |
|
Gender Female Male |
113(37.5) 188(62.5) |
|
Mean age Female Male |
42.87±12.3 42.21±11.7 43.27±12.6 |
|
Trauma causes Accident Falling Fight |
262(87) 32(10.6) 7(2.3) |
Results
Three hundred-one patients were included, comprising 113 females (37.5%) and 188 males (62.5%). The mean age of the participants was 42.87±12.3 years. In the current survey, 602 pedicles were used. The most traumatic causes were accidents (87%), falling (32%), and fighting (2.3%), respectively (Table 1).
Table 2. The association between gender and T12 vertebra parameters
|
T12 parameters |
Mean (SD) |
Mean Rank |
Median (IQR) |
p-value |
|
Pedicle aorta distance (mm2) Male (188) Female (113) |
48.5±4.9 43.6±4.3 |
167.22 122.84 |
46.4(6.6) 43.7(5.5) |
<0.001 |
|
Pedicle Diameter (mm2) Male (188) Female (113) |
8.7±1.7 7.8±1.3 |
172.67 113.81 |
8.85(1.47) 7.95(1.84) |
<0.001 |
|
Pedicle height (mm2) Male (188) Female (113) |
16.2±1.8 15.2±2.0 |
168.51 120.7 |
16.3(2.3) 15(2.64) |
<0.001 |
|
Pedicle area (mm2) Male (188) Female (113) |
2.5±0.59 2.2±0.45 |
166.72 123.66 |
2.52(0.74) 2.3(0.59) |
0.023 |
|
Body aorta distance (cm2) Male (188) Female (112) |
1.9±0.63 2.2±1.4 |
153.29 144.5 |
1.9(0.75) 1.73(1) |
0.311 |
|
Pedicle body distance/body aorta distance. T12 Male (188) Female (112) |
47.7±4.9 45.8±4.4 |
164.92 126.64 |
48.6(6.6) 46.1(5.59) |
<0.001 |
Table 3. The association between age and T12 vertebra parameters
|
T 12 parameters |
Mean (SD) |
Mean Rank |
Medican (IQR) |
p-value |
|
Pedicle body distance 18-35 (91) 36-50 (132) 51-70 (78) |
45(4.8) 45.4(4.6) 44.3(4.8) 45.5(4.9) |
160.2 140 158 |
46.2(5.5) 44.6(6.5) 45.9(7.8) |
0.152 |
|
Pedicle Diameter 18-35 (91) 36-50 (132) 51-70 (78) |
8.3(1.6) 8(1.95) 8.5(1.3) 8.4(1.6) |
139.6 161.6 146.2 |
8.44(2.65) 8.68(1.53) 8.25(2.29) |
0.154 |
|
Pedicle Height 18-35 (91) 36-50 (132) 51-70 (78) |
15.8(1.9) 16(1.9) 15.8(2) 15.6(1.8) |
161.4 150.1 140.2 |
16(2.6) 15.85(2.9) 15.75(2.53) |
0.283 |
|
Pedicle Area 18-35 (91) 36-50 (132) 51-70 (78) |
2.4(0.5) 2.4(0.6) 2.4(0.5) 2.4(0.5) |
150.7 153 147.8 |
2.44(0.88) 2.46(0.64) 2.44(0.55) |
0.917 |
|
Body aorta distance 18-35 (91) 36-50 (132) 51-70 (78) |
2(1) 1.9(0.9) 2(1) 2.1(1) |
134.8 150.4 168.6 |
1.78(0.63) 1.9(0.96) 2(0.81) |
0.042 |
|
Pedicle body distance/body aorta distance. T12 18-35 (91) 36-50 (132) 51-70 (78) |
47(4.8) 47.3(4.6) 46.4(4.8) 47.7(5) |
157.7 140.3 161.2 |
48.54(6) 46.83(6.37) 48.25(8.45) |
0.164 |
T12 Pedicle Morphometry
Evaluating Gender Influence on T12 Pedicle Morphometry
Following the comparison between two genders, it was observed that the mean of T12 vertebra parameters, including left pedicle aorta distance (48.5 vs. 43.6 mm2) (p-value <0.001), left pedicle diameter (8.7 vs. 7.8 mm2) (p-value <0.001), left pedicle height (16.2 vs.15.2 mm2) (p-value<0.001), and left ratio of pedicle body aorta distance/body aorta distance (47.7 vs.45.8 cm2) (p-value<0.001) were significantly higher in men than women (Table 2). No difference was found between males and females for the left body aorta distance (1.9 vs.2.2 cm2) (p-value=0.3) (Table 2).
The results of logistic regression demonstrated the higher correlation between men and left pedicle body distance (p-value<0.001) (OR=0.9, 95% CI= 0.86-0.95), left pedicle diameter (p-value<0.001) (OR=0.7, 95% CI=0.59-0.82), left pedicle height (p-value=0.005) (OR=0.81, 95% CI=0.7-0.94), left pedicle area (p-value=0.013) (OR=0.53, 95% CI= 0.32-0.87), left body aorta distance (p-value =0.017) (OR=1.33, 95% CI=1-1.7), and left ratio of pedicle body aorta distance/body aorta distance (p-value <0.001) (OR=0.9, 95% CI=0.86-0.95).
Evaluating Age Influence on T12 Pedicle Morphometry
All the patients were classified into three groups based on age, including 18-35, 36-50, and 51-70 years. The analysis showed a significant difference between ages just for left body aorta distance (p-value = 0.04) (Table 3). Post hoc analysis revealed that in patients with 36-50 years, the mean body aorta distance was significantly higher (p-value =0.02).
L1 Pedicle Morphometry
Evaluating Gender Influence on L1 Pedicle Morphometry
The results demonstrated that the mean of left pedicle diameter (8.4 vs.7.7mm2) (p-value<0.001), left pedicle height (15.7 vs.15mm2), left pedicle area (2.57 vs.2.8 mm2) (p-value<0.001), and the left ratio of pedicle body aorta distance/body aorta distance (49.7 vs. 47.9 cm2) (p-value<0.001) (Table 4). Also, the analysis revealed that left pedicle body distance had the most difference between two genders (47.33 vs. 45.13 mm2) (p-value<0.001) (Table 4). In contrast, no significance was observed for body aorta distance (2.45 vs. 2.8 cm2) (Table 4).
The results of logistic regression demonstrated the higher correlation between men and left pedicle body distance (p-value=0.019) (OR=0.9, 95% CI= 0.83-0.98), left pedicle diameter (p-value=0.027) (OR=0.85, 95% CI=0.73-0.98), left pedicle height (p-value=0.011) (OR=0.81, 95% CI=0.7-0.95), left body aorta distance (p-value=0.005) (OR=1.29, 95% CI=1-1.54), and left ratio of pedicle body aorta distance/body aorta distance (p-value<0.001) (OR=0.9, 95% CI=0.85-0.95).
Table 4. The association between gender and L1 vertebra parameters
|
L1 parameters |
Mean (SD) |
Mean Rank |
Median (IRQ) |
p-value |
|
Pedicle body distance (mm2) Male (188) Female (113) |
47.33±4.13 45.13±3.67 |
169.82 118.52 |
47.7(4.4) 45.8(4.25) |
<0.001 |
|
Pedicle diameter (mm2) Male (188) Female (113) |
8.40±2 7.7±1.5 |
167.59 122.23 |
8.42(2.12) 7.79(2) |
<0.001 |
|
Pedicle height (mm2) Male (188) Female (113) |
15.7±1.7 15±1.6 |
163.07 129.70 |
15.6(2.5) 15(2.3) |
<0.001 |
|
Pedicle area (mm2) Male (188) Female (113) |
2.57±0.64 2.28±0.52 |
166.9 121.78 |
2.6(0.78) 2.25(0.51) |
<0.001 |
|
Body aorta distance (cm2) Male (188) Female (112) |
2.45±1 2.8±1.7 |
148.22 152.97 |
2.2(1.29) 2.24(1.88) |
0.645 |
|
Pedicle body distance/body aorta distance. L1 Male (188) Female (112) |
49.7±4.3 47.9±4.3 |
164.77 126.88 |
50.2(4.84) 48.3(4.92) |
<0.001 |
Table 5. The association between age and L1 vertebra parameters
|
L1 Parameters |
Mean(SD) |
Mean Rank |
Median(IQR) |
p-value |
|
Pedicle body distance (mm2) 18-35 (91) 36-50 (132) 51-70 (78) |
46.5(4.1) 46.8(3.6) 46.2(4.4) 46.6(4) |
161.9 144.9 148.5 |
47.5(3.38) 46.5(4.6) 46.8(5.33) |
0.345 |
|
Pedicle Diameter (mm2) 18-35 (91) 36-50 (132) 51-70 (78) |
8.1(1.8) 7.8(2.1) 8.2(1.8) 8.3(1.5) |
143.7 155.1 152.3 |
8.14(2.06) 8.35(2.21) 8.18(2.27) |
0.624 |
|
Pedicle Height (mm2) 18-35 (91) 36-50 (132) 51-70 (78) |
15.5(17) 15.9(1.7) 15.4(1.7) 15(1.7) |
174.1 150.9 124 |
15.8(2.45) 15.5(2.10) 14.7(2.23) |
0.001 |
|
Pedicle Area (mm2) 18-35 (91) 36-50 (131) 51-70 (78) |
2.4(0.6) 2.4(0.6) 2.4(0.6) 2.5(0.5) |
148.3 146.4 159.8 |
2.48(0.75) 2.42(0.64) 2.53(0.63) |
0.533 |
|
Body aorta distance (cm2) 18-35 (91) 36-50 (132) 51-70 (78) |
2.5(1.3) 2.2(1) 2.6(1.4) 2.9(1.5) |
131.2 148 176.8 |
2.07(1.12) 2.09(1.7) 2.64(1.5) |
0.003 |
|
Pedicle body distance/body aorta distance. L1 18-35 (91) 36-50 (132) 51-70 (78) |
49(4.4) 49(3.9) 48.8(4.8) 49.5(4.1) |
152.8 143.9 160.8 |
49.85(4.03) 48.7(5.09) 50.16(6) |
0.385 |
Evaluating Age Influence on T12 Pedicle Morphometry
Following comparing the participants for age, a significant difference was revealed in left pedicle height (p-value<0.001) and left body aorta distance (p-value=0.003) (Table 5). Post hoc analysis indicated that the mean left pedicle height in 18-35 years is significantly higher than patients with 51-70 years (15.9 vs.15mm2) (p-value<0.001). In contrast, left body aorta distance increases with ageing. Further Post-Hoc analysis showed a significant difference between patients 18-35 and 51-70 years old (p-value=0.002).
Discussion
Spine surgeons employ various techniques and implants to achieve three-dimensional correction of spinal deformities. Among them, posterior spinal fusion with pedicle screws is the gold standard in treating spinal disorders. Despite these advantages, the proximity of the pedicle to the spinal canal and large vessels has made its operation risky. On the other hand, implantation in deformed and rotated pedicles in scoliosis makes the operation more complicated and dangerous. Some reports regarding the highest possibility of pedicle perforation were reported in scoliosis using a CT scan (6-8).
Wrong placement of screws can cause irreparable damage to vital organs such as the aorta, spinal cord, and lungs; also, the misplaced pedicle screw has a high probability of breaking out (9). Therefore, to improve the accuracy of pedicle screw insertion, several methods such as insertion under fluoroscopy guidance, CT scan, intraoperative electromyography, or control of sensation and movement in the distal parts of the body have been described (10).Radiation-controlled methods are expensive and time-consuming, putting the patient and the surgeon at risk of exposure to X-rays. In the “free-hand” operating procedure, the surgeon uses anatomical signs during the operation and radiological signs before the operation. Nevertheless, anatomical changes in the patients can make screw placement challenging (11,12). Even in the experienced hands of skilled surgeons, crossing the safe margin of the pedicle wall can occur in up to 29% of the cases (13).
This study presents morphometric data on lower thoracic and upper lumbar spine (thoracolumbar junction) pedicles in a homogenous population to determine the anatomical parameters influencing the selection of thoracic and lumbar left pedicle screw sizes for surgery. The results have demonstrated a significant difference between genders for all the left pedicle parameters. In comparison, the safe pedicle height in L1 decreases with ageing. This contrasts with a similar investigation, showing that body mass index and age do not influence the pedicle dimensions (14).
In addition to the pedicle’s height, diameter, and length, the pedicle’s insertion angle influences the pedicle screw pullout strength and the bone-screw construct stiffness (15). Agrawal et al, with morphometric analysis of the C2 pedicle, have revealed that screw diameter of 2.7 mm is safe (16).
Verma et al observed the most expansive pedicle height in the T12 vertebra in the Indian population (17). In contrast with the results of the present study, there was no difference between genders for pedicle parameters (17). The results demonstrated increasing left pedicle parameters from T12 and decreasing in L2 vertebras. Hence, the ideal pedicle entry points also change with changes in anatomical levels. The superior facet at the junction of the lateral and middle thirds was one of the perfect points for pedicle entry at the thoracic level (18). However, this has the most efficacy in curves less than 90 degrees (19).
The findings indicated that 45- and 46.5-mm left pedicle aorta distances are safe for T12 and L1 pedicles, respectively. However, this safety is influenced by factors such as patient position (20). In the T4-L4 vertebras, the patient’s position during surgery affected safe zones relative to the aorta (20,21). In this line, protruding tips of the screw less than 3 mm are recommended to prevent aorta injury during surgery (22). In our data, the optimal pedicle diameters for T12 and L1 vertebras were 8.3 and 8.1, respectively. However, in determining the safe zone for pedicle morphometry, considering pedicle angulation is necessary (23). Also, significant differences were found between genders for pedicle morphometry, but no difference was observed between various ages. These findings agree with Charles Yu et al, who demonstrated that age and race do not influence the optimal safe zone of pedicles, whereas taller and heavier individuals had larger lumbar pedicles (24).
Further analysis showed that the height, diameter, and area rise with age. Body aorta distance was the only parameter with the lowest difference when adjusted for age and gender. The hidden anatomical information is the main challenge in free-hand surgery, which requires excessive surgery experience. To improve this issue, new methods have been introduced to increase the accuracy of pedicle screw placement (25,26). Liu et al indicated the “slide technique” – a novel free-hand method for improving the accuracy of pedicle screw placement in cervical vertebras. Their results revealed a safe and cost-effective outcome (27).
The main strength of the present survey is focusing on safe zone of pedicle screws in the Iranian population. However, lack of data, such as pedicle angle placement and surgery complications, limited the data in the present study. Also, it was found that whether the surgeon is right-handed or left-handed also affects the surgical outcome, which was not investigated in this study.
Conclusion
The present investigation has shown valuable data regarding the safe zone of the T12 and L1 left vertebrae pedicles. Additionally, there were significant differences between genders for pedicle morphometry, which can be helpful before surgery. Further analysis by measuring left pedicle angle placement and specific positions during surgery is highly recommended.
Acknowledgement
We thank all our colleagues at Allied Health Sciences School, Ahvaz Jundishapur University of Medical Sciences. Ahvaz Jundishapur University of Medical Sciences ethics committee approved the study (IR.AJUMS.AC.IR.HGOLESTAN.REC.1399.074). Informed consent was obtained from all the patients before participation in the study.
Conflict of Interest
There was no conflict of interest in this manuscript.